Overview #
In our school/High School/University, we all atleast once studied statistics in our life. But did you ever thought that it can also be used in detection engineering. I know you are raising your eyebrows and saying what, really we have to use statistics in detection engineering. Don’t worry after reading this blog you will understand where we can use this and your statistics concepts will also be refreshed.
[!NOTE] : If you spot any mistakes or areas for improvement in my blog, feel free to reach out to me via email or on any platform. I welcome constructive feedback and am always eager to enhance the quality of my content.
When to use statistics ? #
I will try to answer this question using an example.
Scenario: We have logs that contains information about user web activity or transaction logs, in such scenario if we want to find the anomaly in user activity so creating detection using static threshold values will not be a better approach as the threshold can change for each user depend on day, position of person etc. Here we can use concepts from statistics like IQR (Interquartile Range), Standard Deviation, MAD ( Median Absolute Deviation) which I will cover in this post.
Statistics Refresher #
I will try to cover topics so that it can help us in developing detection, if you want to learn them in depth I will be adding links to learning sources also which you can use.
What is Statistics ? #
Statistics is the discipline that concerns the collection, organization, analysis, interpretation, and presentation of data. [Definition from Wikipedia]
Concepts we will explore #
- Mean
- Median
- Standard Deviation
- Mean Absolute Deviation
- Median Absolute Deviation
- Interquartile Range (IQR)
- Outlier
Mean #
Mean is just the sum of observation divided by total number of observation and sometimes we call it average also.
\[\text{Mean} = \frac{\sum_{i=1}^{n} x_i}{n}\]
Median #
This is used to find central tendency of data arranged in ascending or descending order.
Find Median of odd number of values \[ \text{Median} = x_{\frac{n+1}{2}} \]
Find Median of even number of values \[ \text{Median} = \frac{x_{\frac{n}{2}} + x_{\frac{n}{2} + 1}}{2} \]
Standard Deviation #
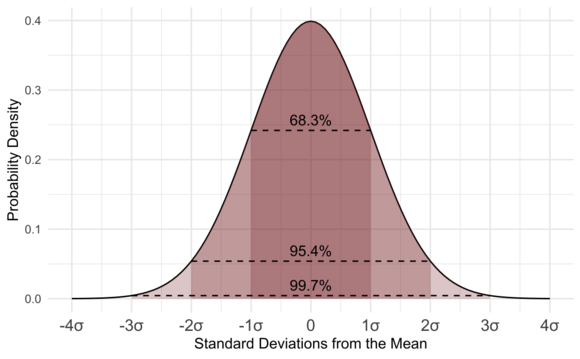
This helps us to find out how spread or dispersed a set of data from the mean/avg.
\[ \sigma = \sqrt{\frac{\sum_{i=1}^{n} (x_i - \bar{x})^2}{n - 1}} \]
\[ \text{ Mean }: \bar{x} \]
Standard Deviation Example
Let’s understand Standard Deviation with example. We have two teams Team A & Team B and it be possible that both team have same avg. (mean) age, but both have different standard deviation. Example Team A deviation can be 2 and Team B can have devation of 10, it means in Team A all members are of similar age group like 19 to 21 if mean is 20. Team B have members variation in age group like 10 to 30 if mean is 20.
Mean Absolute Deviation #
Mean Absolute Deviation before understanding this, let’s learn why we required this.

\[ \text{Mean} = \frac{190 + 120 + 110 + 100 + 120}{5} \]
\[ \bar{x} = \text{ 128 }\]
In the above all height is in range of 100-120 but one person height is 190 which increases mean.
| Height | Mean | Deviation [ Height - Mean ] |
|---|---|---|
| 190 | 128 | 62 |
| 120 | 128 | 8 |
| 110 | 128 | 18 |
| 100 | 128 | 28 |
| 120 | 128 | 8 |
\[ \text{Mean Absolute Deviation} = \frac{62 + 8 + 18 + 28 + 8}{5} = \text{ 24.8 } \]
This shows that few data are having more deviation from Mean and this shows that our data is spread or there is inconsistency in data.
Median Absolute Deviation #
Median Absolute Deviation is similar to Mean Absolute Deviation only difference is here we check deviation from median.

\[ \text{Arranging Ascending Order} = \text{100, 110, 120, 120, 190} \]
\[ \text{Median} = x_{\frac{5+1}{2}} = x_{3} = 120 \]
In the above all height is in range of 100-120 but one person height is 190 but it doesn’t effect our median.
| Height | Median | Deviation [ Height - Median ] |
|---|---|---|
| 190 | 120 | 70 |
| 120 | 120 | 0 |
| 110 | 120 | 10 |
| 100 | 120 | 20 |
| 120 | 120 | 0 |
\[ \text{Arranging Ascending Order} = \text{0, 0, 10, 20, 70} \]
\[ \text{Median Absolute Deviation} = x_{\frac{5+1}{2}} = x_{3} = 10 \]
This shows that how much variation in our data around center. Median Absolute Deviation can be used when there are extreme data points that can skew mean and you want to calculate the variation that is not effected by extreme data points.
Interquartile Range (IQR) #
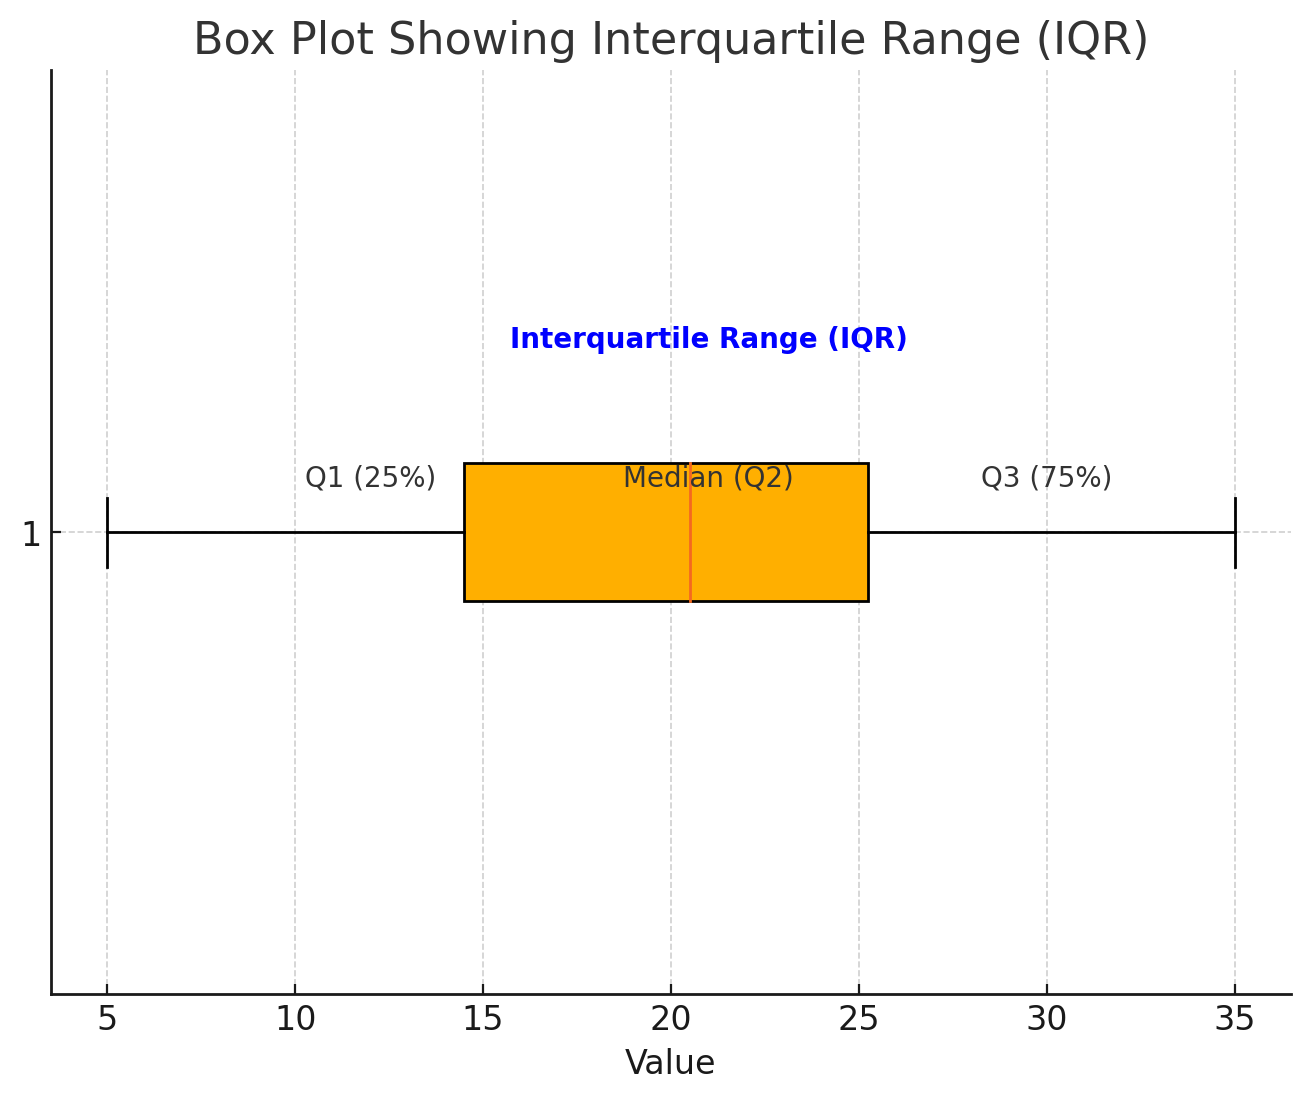
To understand IQR we need to understand percentiles and quartiles.
Percentiles #
It is a value below which certain percentage of data falls in datasets.
\[ P_k = \left( \frac{k}{100} \right) \times (N + 1) \]
\[P_k \text{ is the } k\text{-th percentile,} \] \[k \text{ is the desired percentile (e.g., 25 for the 25th percentile),} \] \[N \text{ is the total number of data points.}\]
Quartiles #
This divide the data in four equal parts.
-
Q1 (First Quartile or 25 percentile): It means 25 percent of data is less than this value
-
Q2 (Second Quartile or 50 percentile): It means 50 percent of data is less than this value
-
Q3 (Third Quartile or 75 percentile): It means 75 percent of data is less than this value
-
Q4 (Fourth Quartile or 100 percentile): It means 100 percent of data is less than this value
IQR is range between Q3 (Third Quartile or 75 percentile) and (First Quartile or 25 percentile).
\[\text{IQR} = Q_3 - Q_1\]
Outlier #
What is Outlier? #
In statistics, an outlier is a data point that differs significantly from other observations. An outlier may be due to a variability in the measurement, an indication of novel data, or it may be the result of experimental error; the latter are sometimes excluded from the data set.[Definition From Wikipedia]
These values can be extremely high or low from normal data.
Finding Outlier in Normal Distribution #

In normal distribution maximum data is between -3σ to +3σ and we can use Standard Deviation to find outliers.
\[\text{Outliers} : : : x < \mu - 3\sigma : \text{or} : x > \mu + 3\sigma\]
\[x \text{ is a data point,} \] \[\mu \text{ is the mean of the distribution,} \] \[\sigma \text{ is the standard deviation.}\]
Finding Outlier in Skewed Distribution #
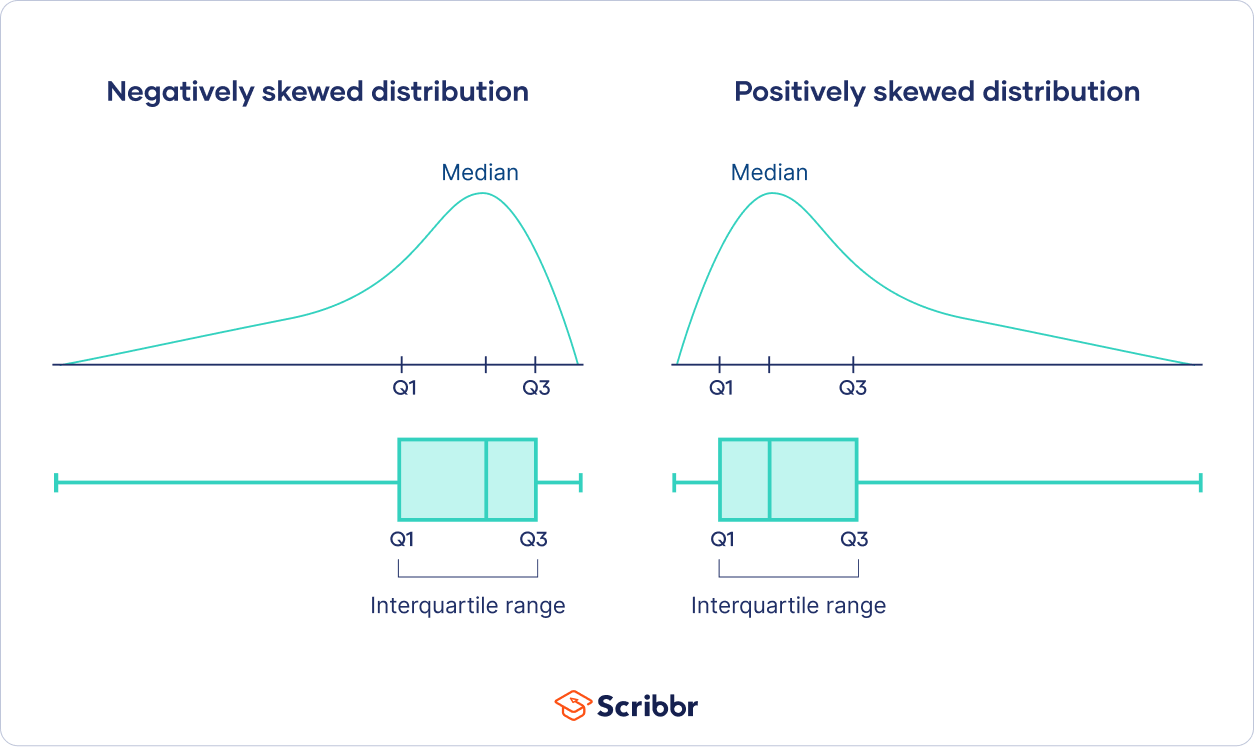
If data is skewed, median and IQR is best for finding outlier as extreme value don’t effect median.
-
calculating range \[\text{IQR} = Q_3 - Q_1\]
-
calculating upper bound \[\text{Upper Bound} = Q_3 + k*IQR\]
-
calculating lower bound \[\text{Lower Bound} = Q_1 - k*IQR\]
\[\text{k (sensitivity) } = 1.5 \text{ (default value)} \]
All data outside upper bound and lower bound range are outliers.
Using statistics in detection engineer ? #
Now it’s time to understand where and how we can use statistics in detection engineering.
We can use same example which is discussed in start of this post.
We have user web access logs and want to detect users that are behaving abnormal. Here abnormal users are outliers for us and we want to find these outlier.
I will be using Splunk for creating detection using statistics functions.
Steps:
- Find field in logs that can be used as input for stats functions.
- Find users normal behavior and upper & lower bound
- Exclude all user which are in upper and lower bound
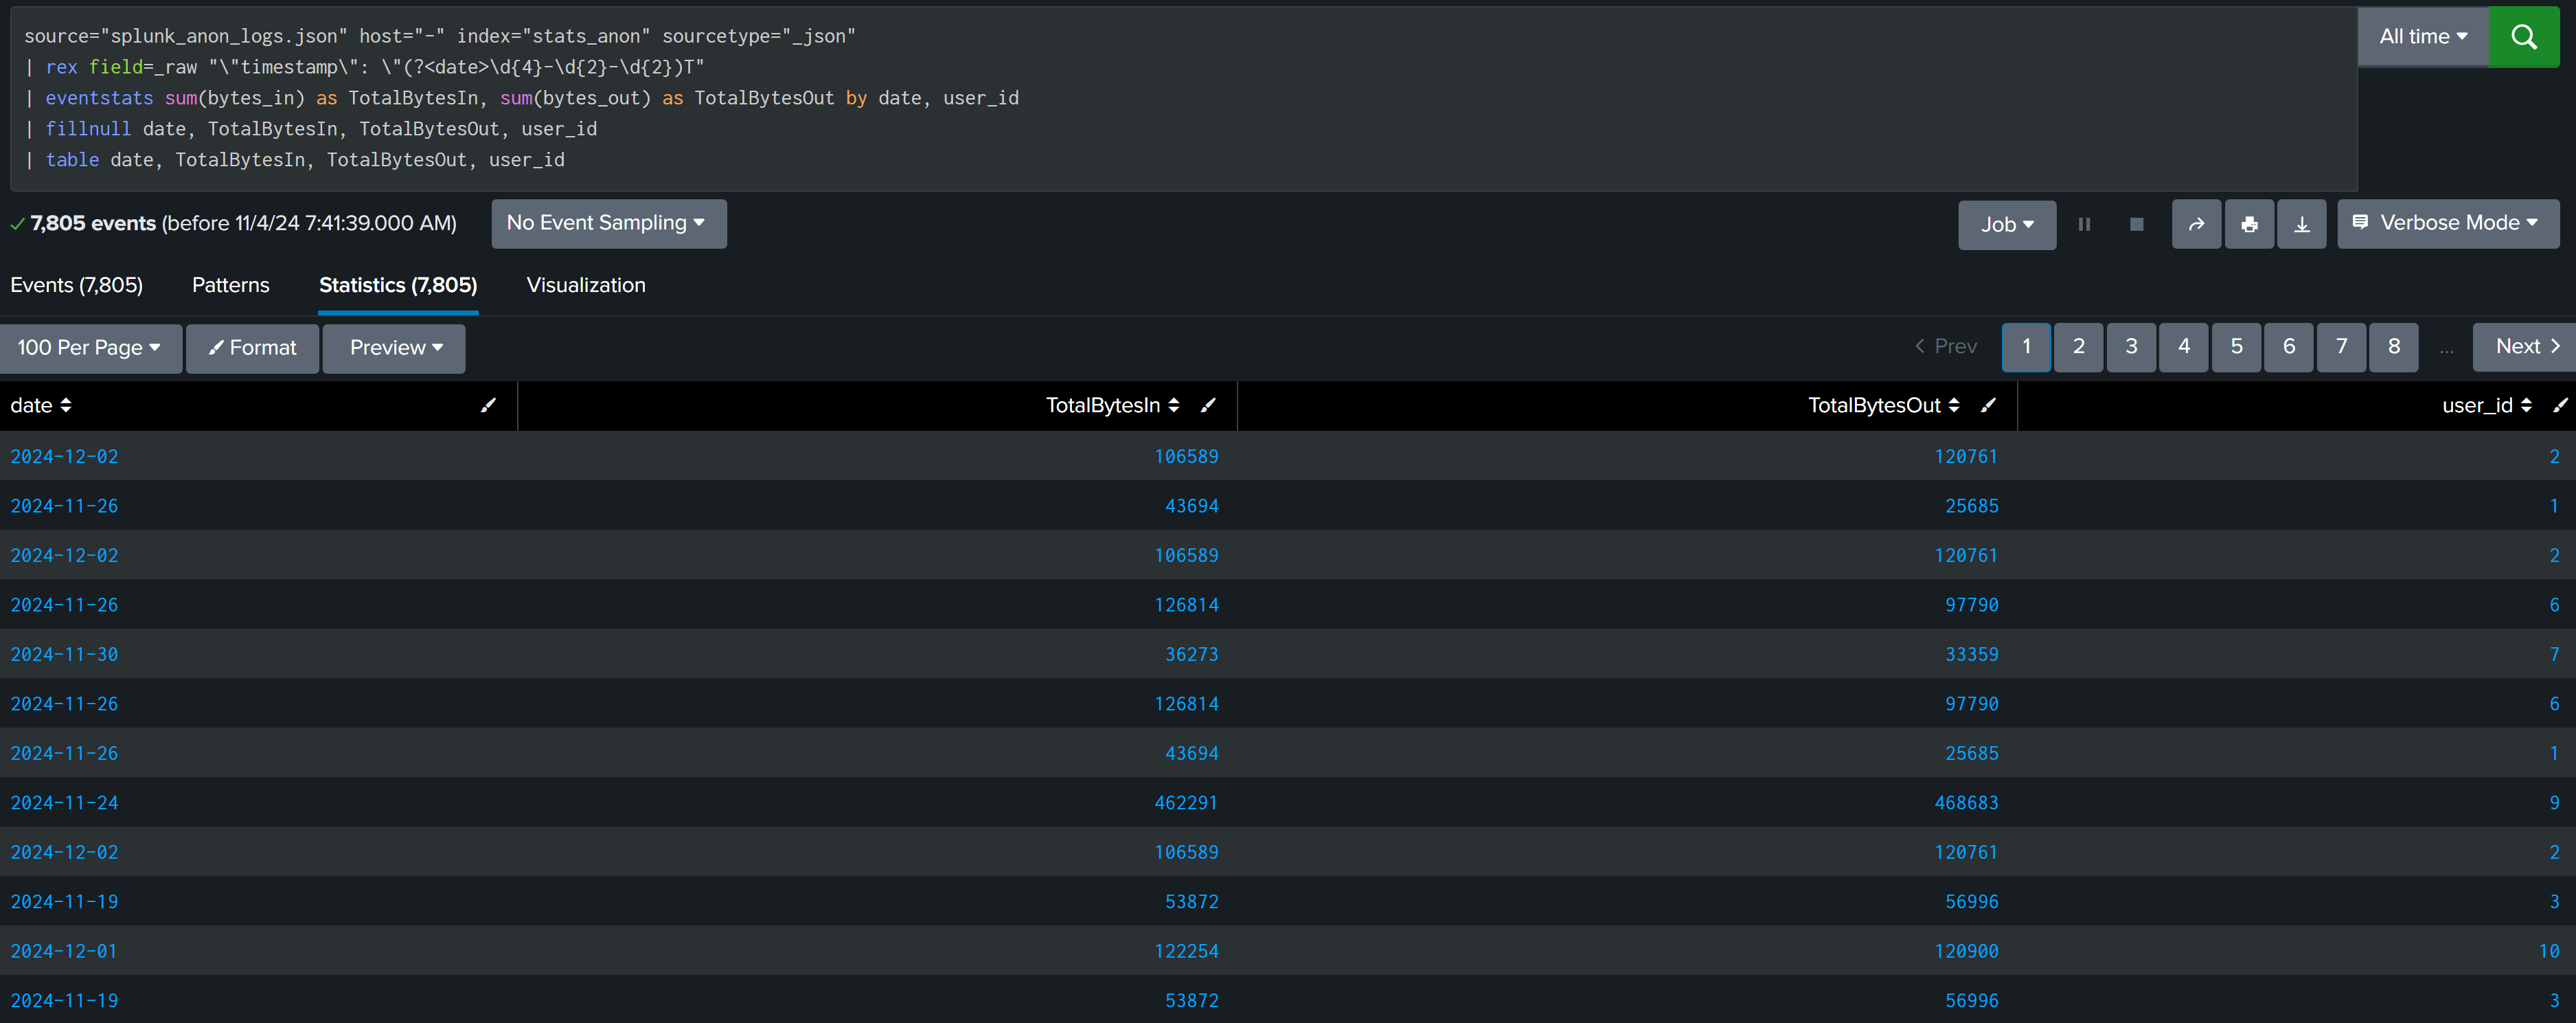
Example : User Web Activity #
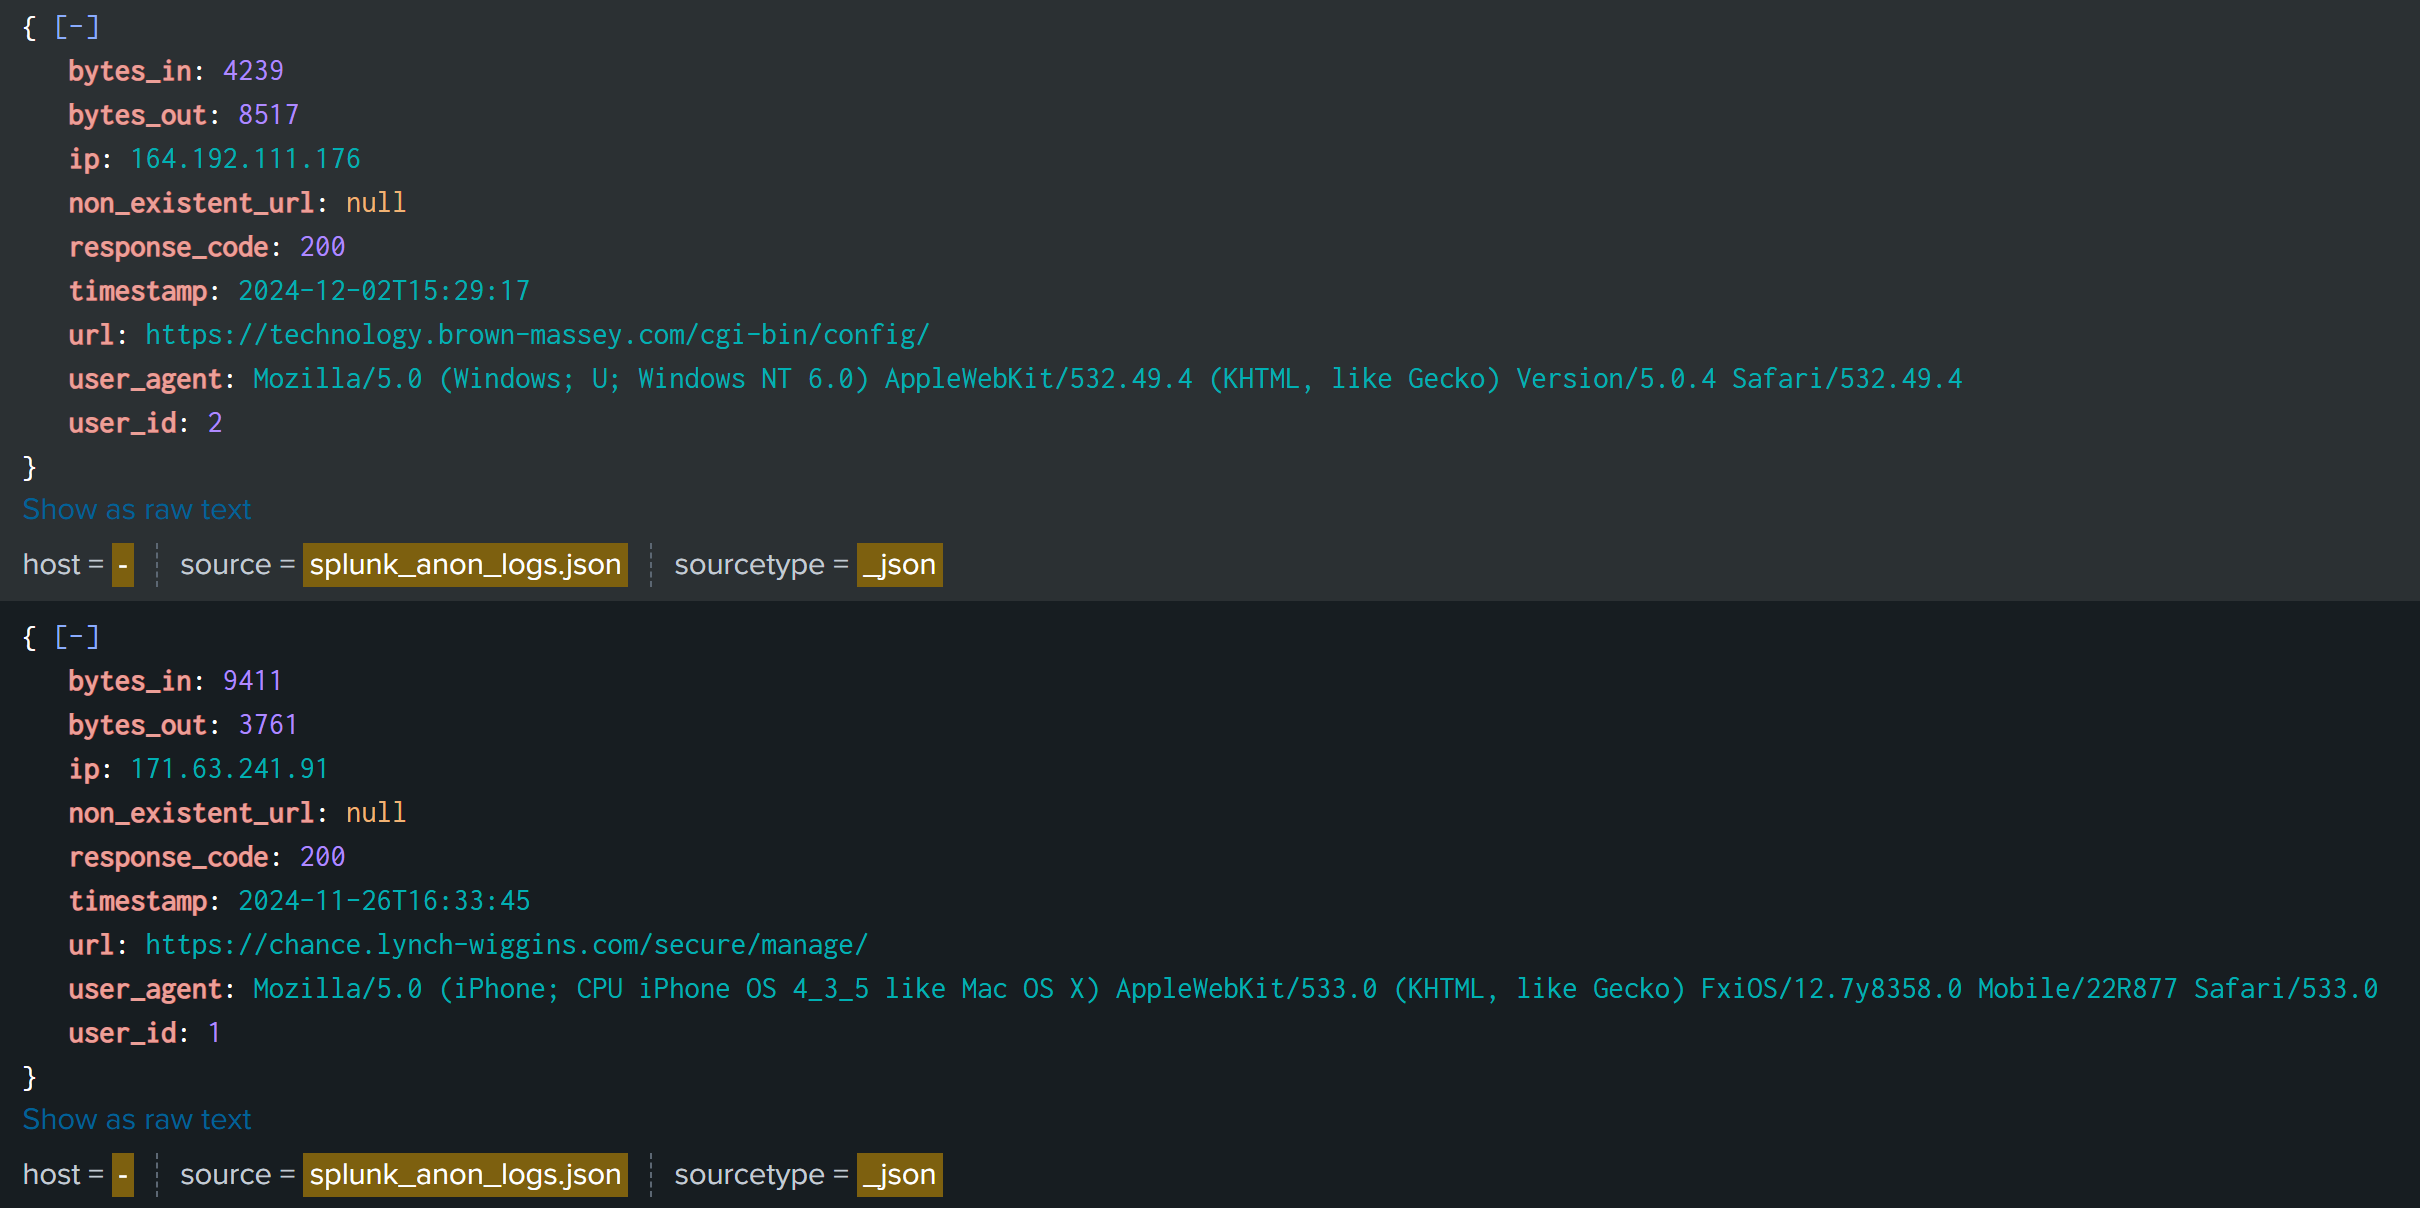
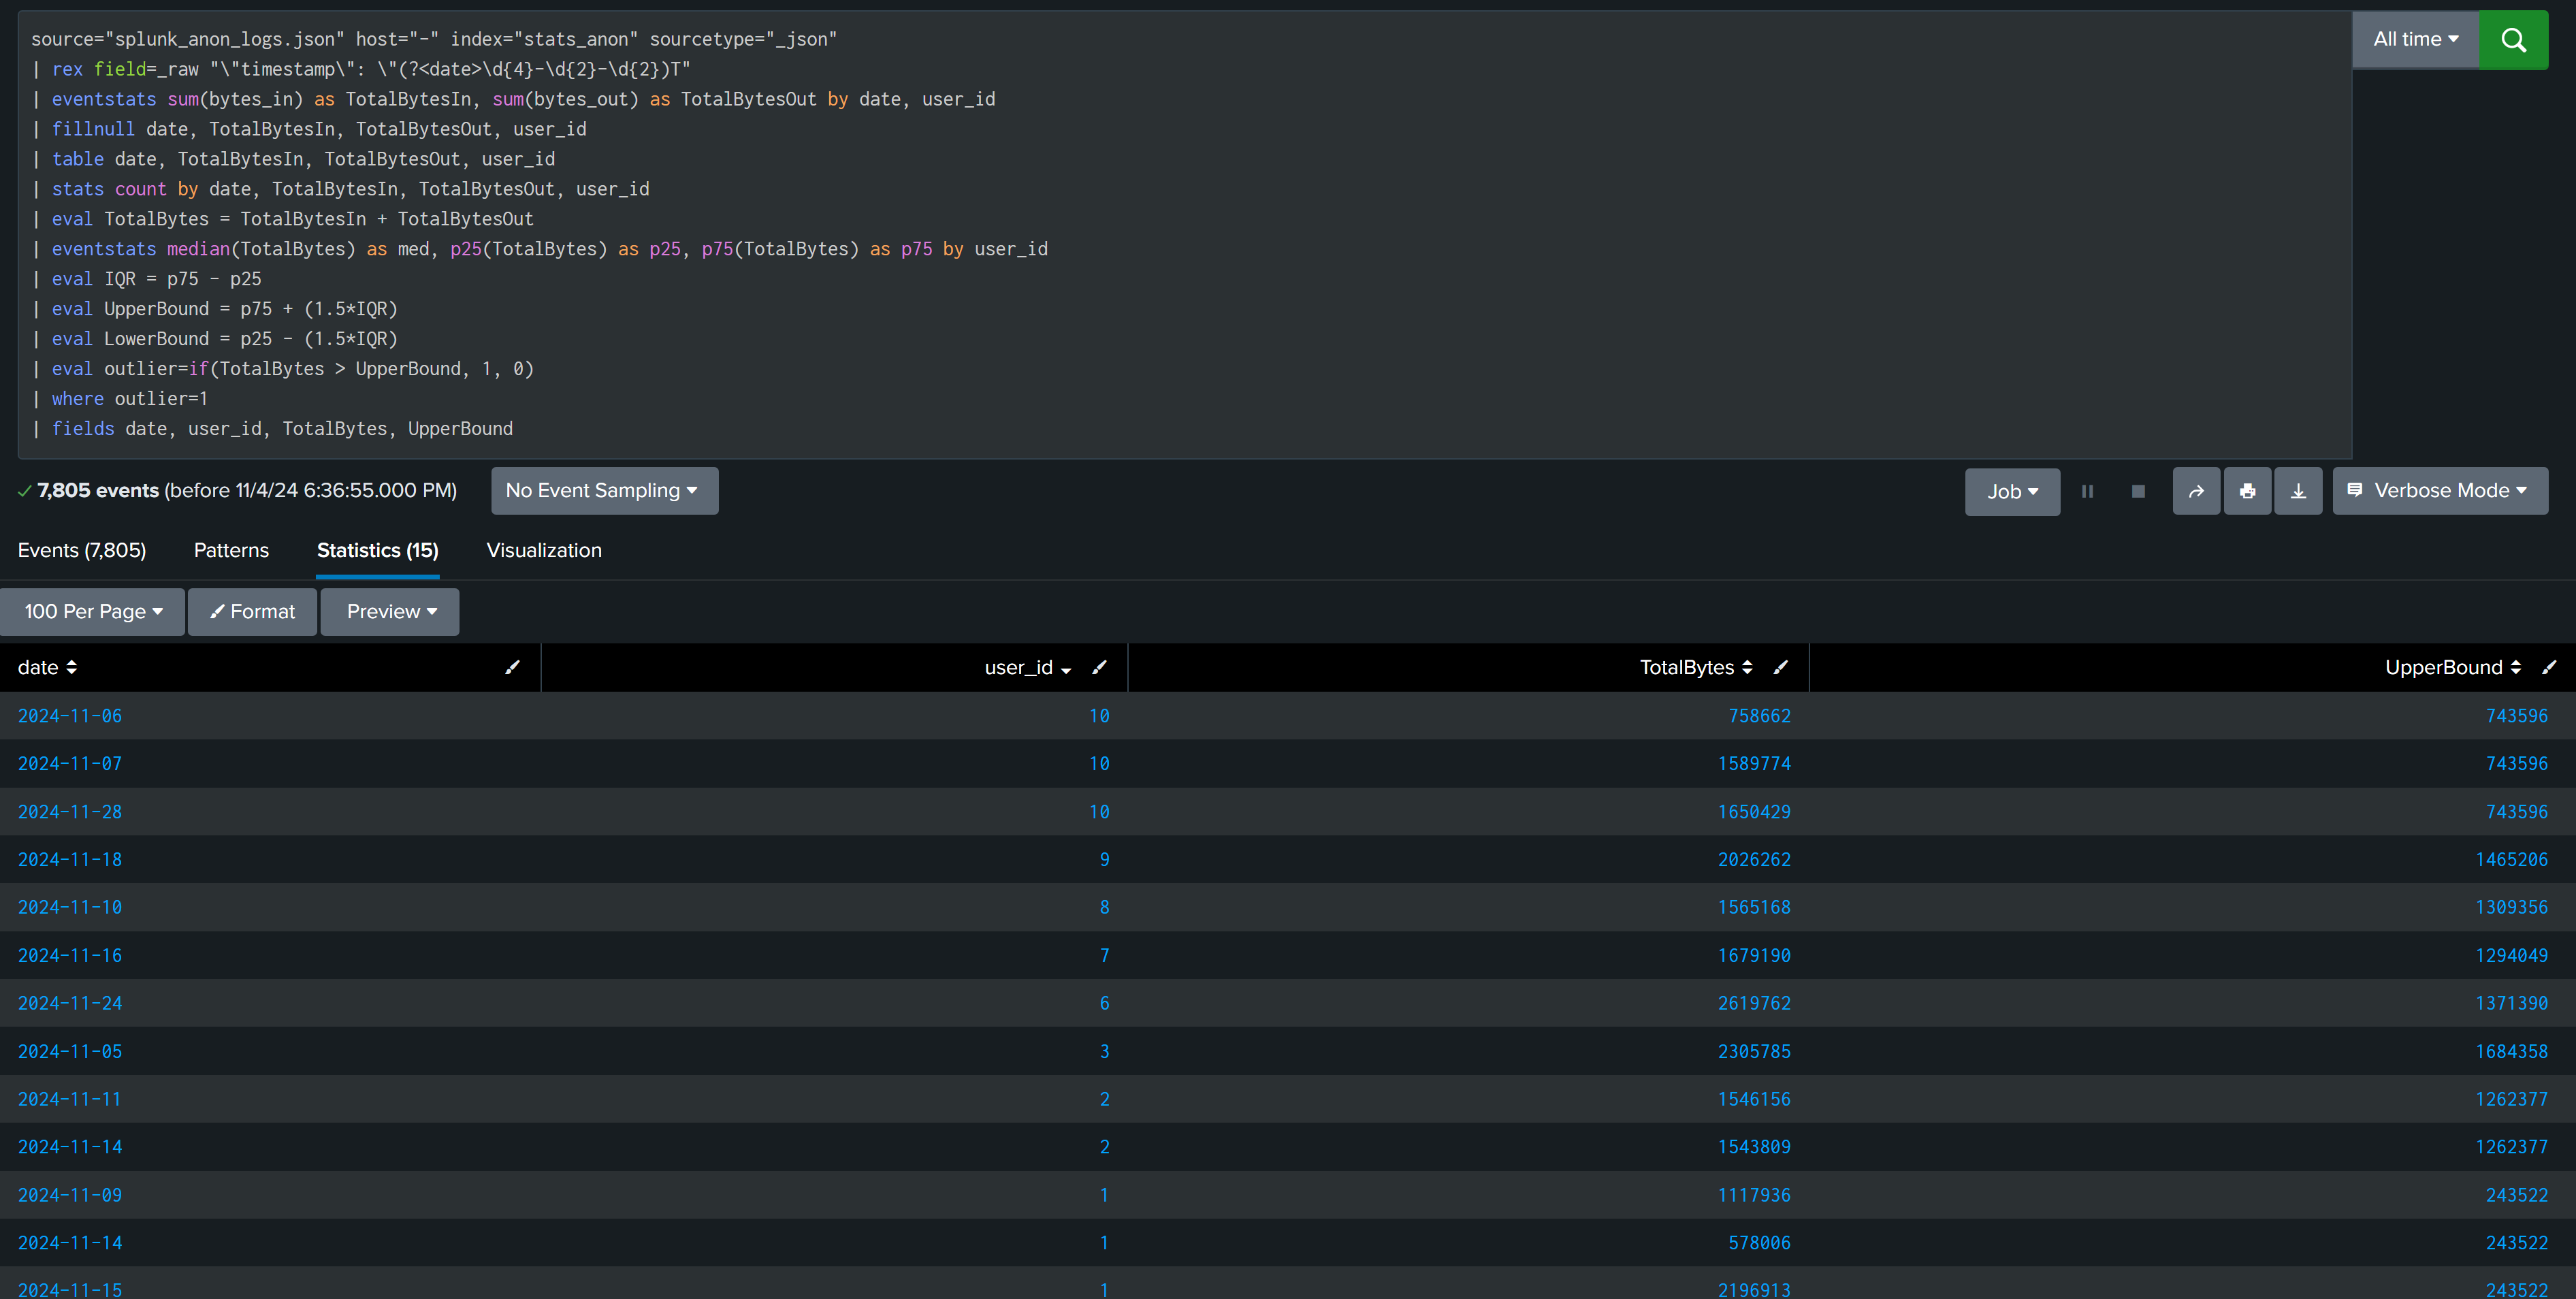
source="splunk_anon_logs.json" host="-" index="stats_anon" sourcetype="_json"
| rex field=_raw "\"timestamp\": \"(?<date>\d{4}-\d{2}-\d{2})T"
| eventstats sum(bytes_in) as TotalBytesIn, sum(bytes_out) as TotalBytesOut by date, user_id
| fillnull date, TotalBytesIn, TotalBytesOut, user_id
| table date, TotalBytesIn, TotalBytesOut, user_id
| stats count by date, TotalBytesIn, TotalBytesOut, user_id
| eval TotalBytes = TotalBytesIn + TotalBytesOut
| eventstats median(TotalBytes) as med, p25(TotalBytes) as p25, p75(TotalBytes) as p75 by user_id
| eval IQR = p75 - p25
| eval UpperBound = p75 + (1.5*IQR)
| eval LowerBound = p25 - (1.5*IQR)
| eval outlier=if(TotalBytes > UpperBound, 1, 0)
| where outlier=1
| fields date, user_id, TotalBytes, UpperBound
Let’s break the above SPL into parts and understand what it does.
| eventstats sum(bytes_in) as TotalBytesIn, sum(bytes_out) as TotalBytesOut by date, user_id
....
....
| eval TotalBytes = TotalBytesIn + TotalBytesOut
| eventstats median(TotalBytes) as med, p25(TotalBytes) as p25, p75(TotalBytes) as p75 by user_id
We want to find outlier based on total bytes [ in and out both ]. Using eventstats calculate the sum of bytes based on user_id per day. After that median, First & Third quartile is calculated for TotalBytes of each user_id.
| eval IQR = p75 - p25
| eval UpperBound = p75 + (1.5*IQR)
| eval LowerBound = p25 - (1.5*IQR)
| eval outlier=if(TotalBytes > UpperBound, 1, 0)
| where outlier=1
Calculated IQR and then upperBound and LowerBound range for TotalBytes and filtered outliers from data to investigate.
In this example we have used 1.5 as multiplier but it is not always the case you have to find and calculate your multiplier based on your data set.
Multiplier can be calculated based on median and IQR or any specific field value.
Example : Credit Card Transaction #
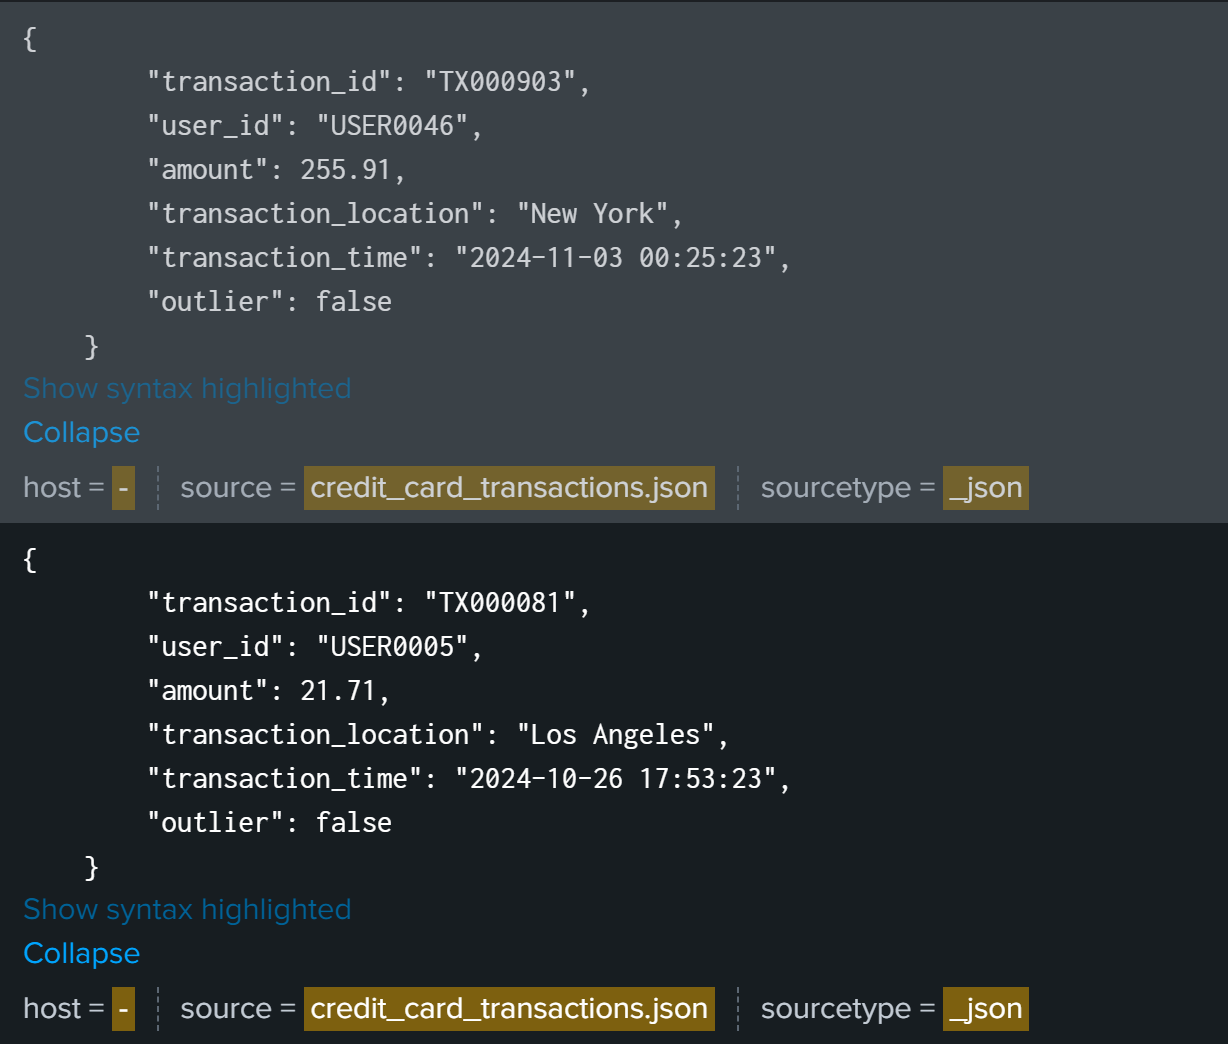
In this example we have details about user credit card transaction which have information like user_id, amount, time, transaction_id and one special field outlier that help us to check if we are actually detecting all outlier or not.
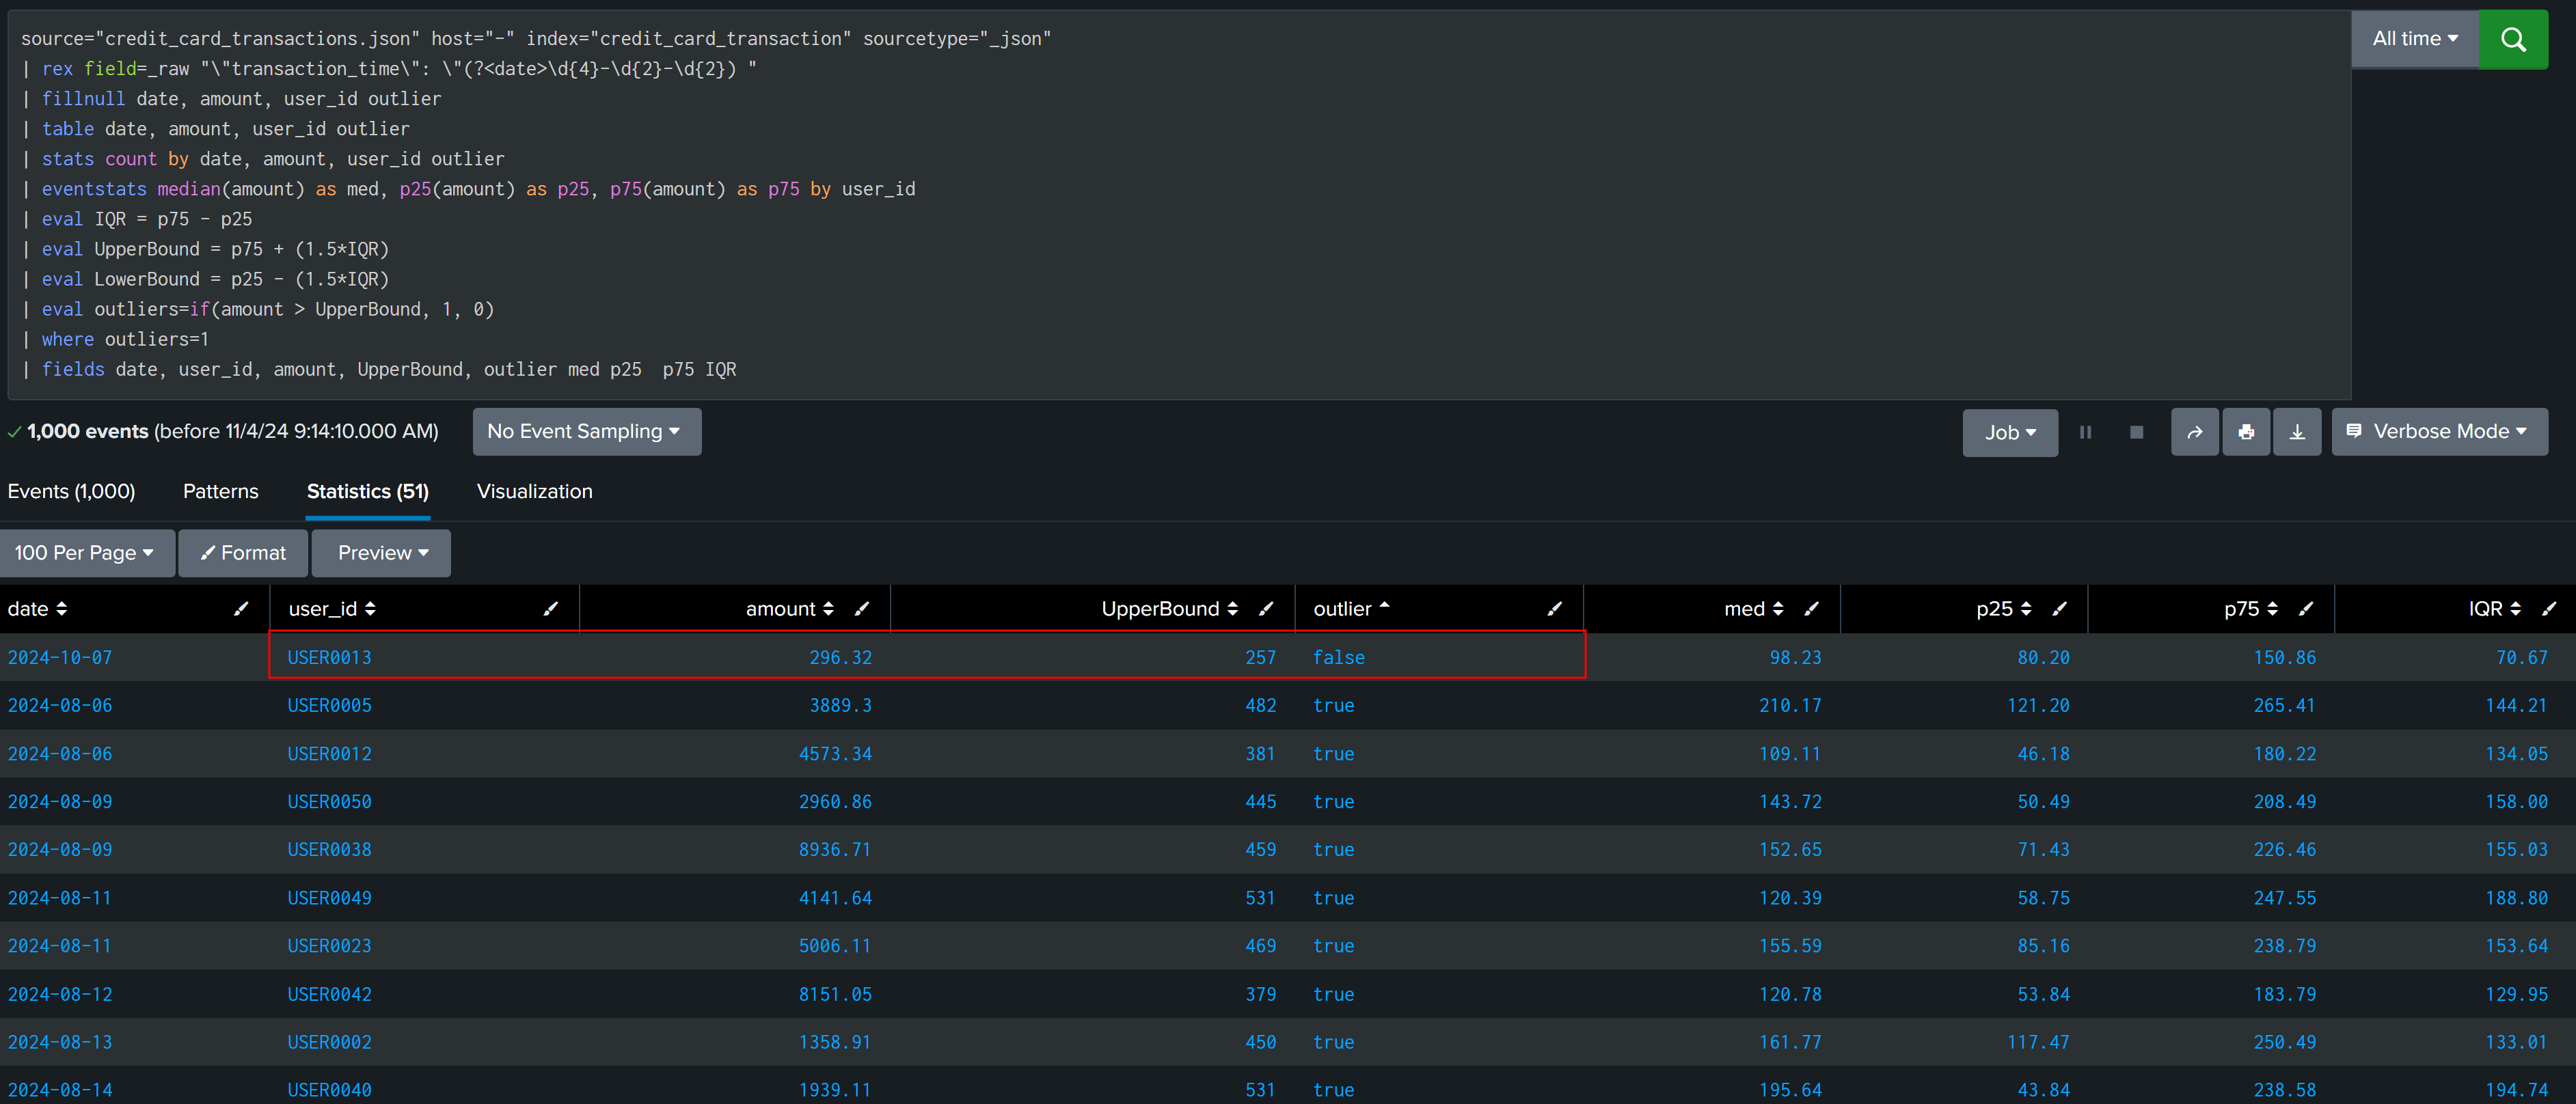
If we use same multiplier 1.5 and this time amount is field which we will be using to detect outlier. It is found that one extra entry we have that is actually not outlier according to data but our calculation mark this also as outlier.
source="credit_card_transactions.json" host="-" index="credit_card_transaction" sourcetype="_json"
| rex field=_raw "\"transaction_time\": \"(?<date>\d{4}-\d{2}-\d{2}) "
| fillnull date, amount, user_id outlier
| table date, amount, user_id outlier
| stats count by date, amount, user_id outlier
| eventstats median(amount) as med, p25(amount) as p25, p75(amount) as p75 by user_id
| eval IQR = p75 - p25
| eval UpperBound = p75 + (1.5*IQR)
| eval LowerBound = p25 - (1.5*IQR)
| eval outliers=if(amount > UpperBound, 1, 0)
| where outliers=1
| fields date, user_id, amount, UpperBound, outlier med p25  p75 IQR
This is the case in which default multiplier don’t work and we have to calculate multiplier, it can be static like a numeric value or we can generate it dynamically based on different parameters like median, IQR, days etc.
Let’s first try MAD [ median absolute deviation ] to find how much each entry is deviated from median and try to observe a pattern that can help us in finding outliers with better results. But MAD is zero for most of the found outliers.
| eval diffs = amount - med
| eventstats median(diffs) as mad by user_id
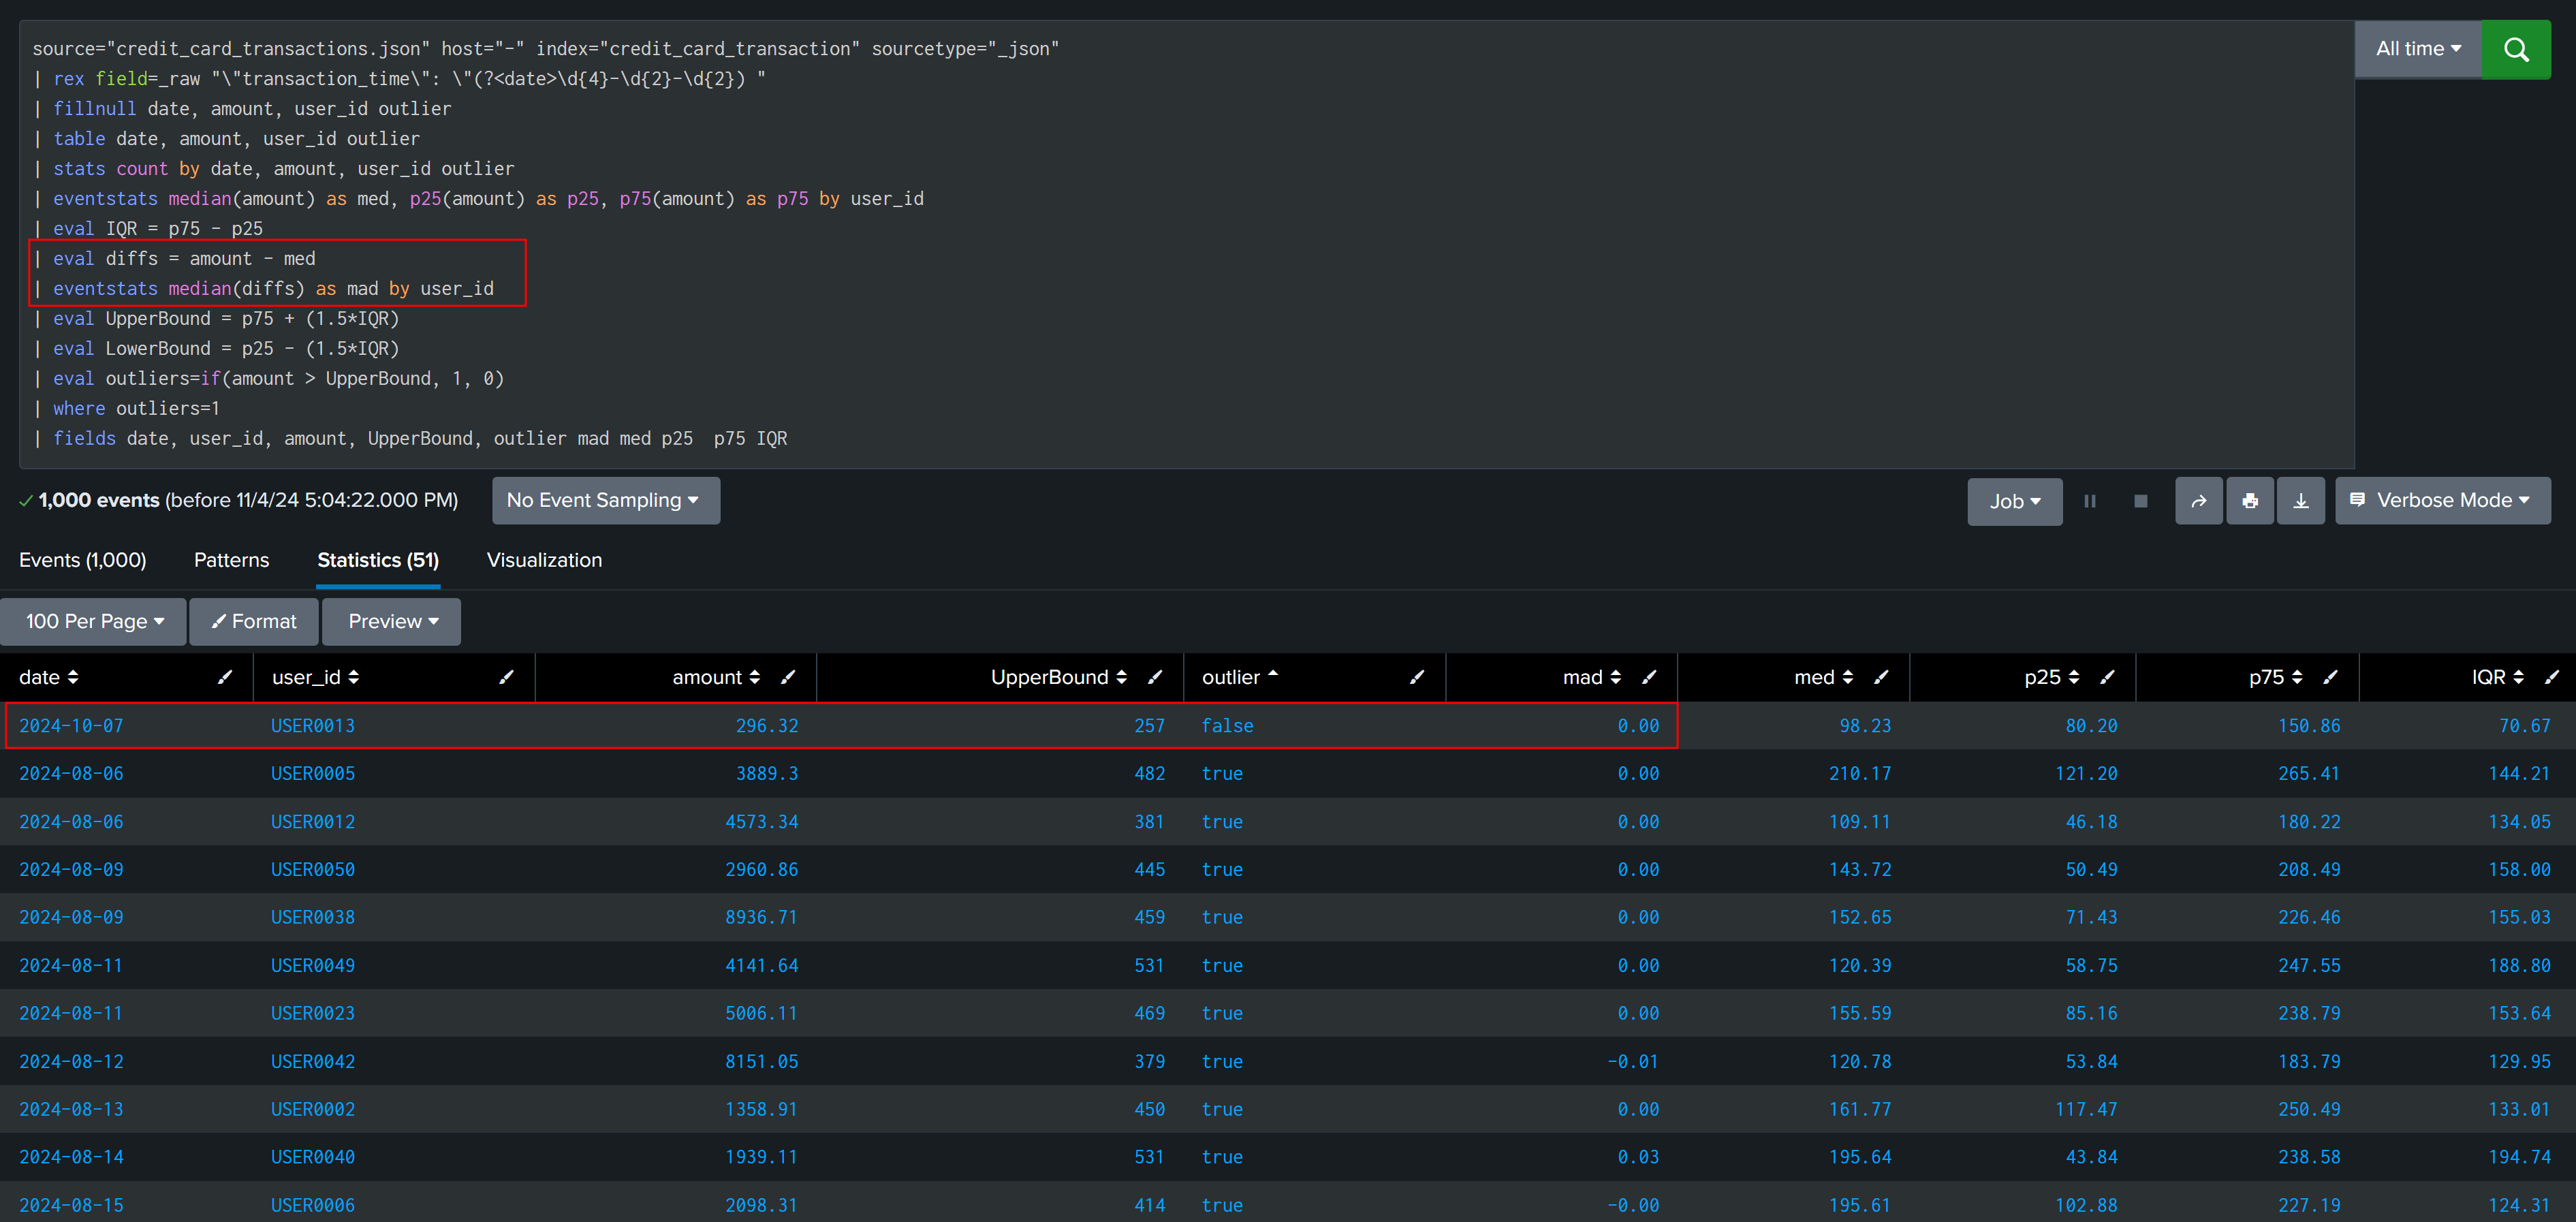
After observing and analyzing data, it is found that outliers are having median and IQR > 100, and our false finding have IQR and median less than 100, this can be used to create multiplier.

| eval multiplier=if(IQR < 100 and med < 100,2,1)
| eval UpperBound = p75 + ((1.5*multiplier)*IQR)
| eval LowerBound = p25 - ((1.5*multiplier)*IQR)
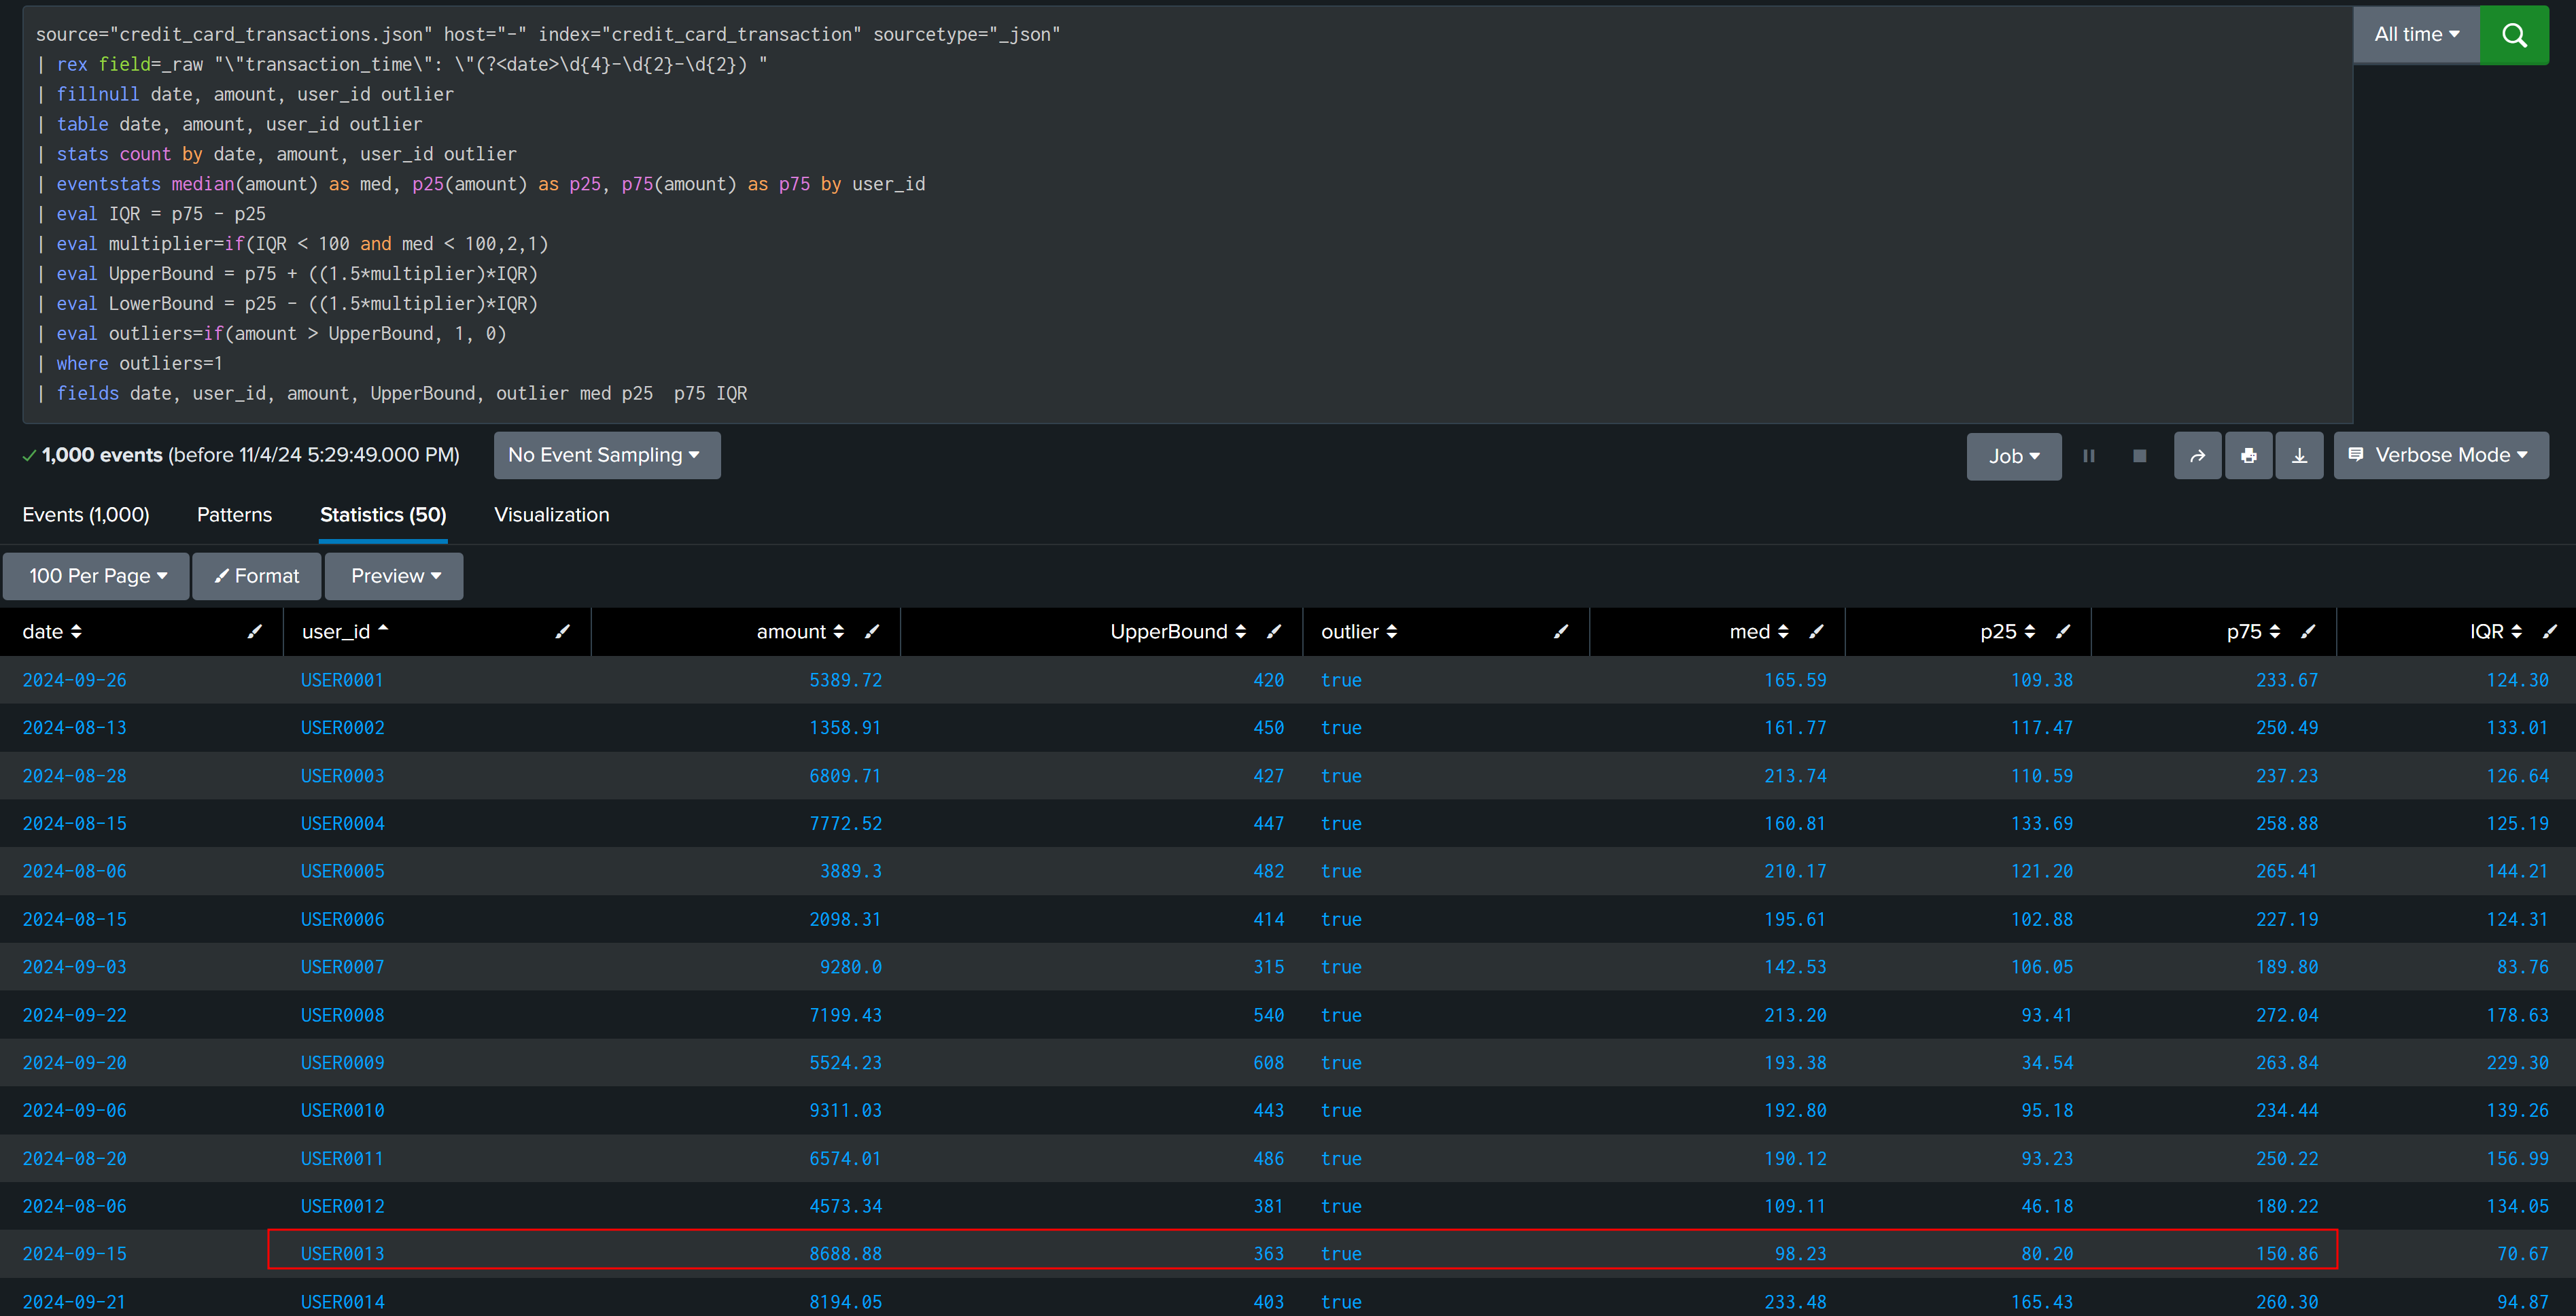
In this way we have finally found all outliers and all True Positive, This solution will not work in all cases.
Bonus #
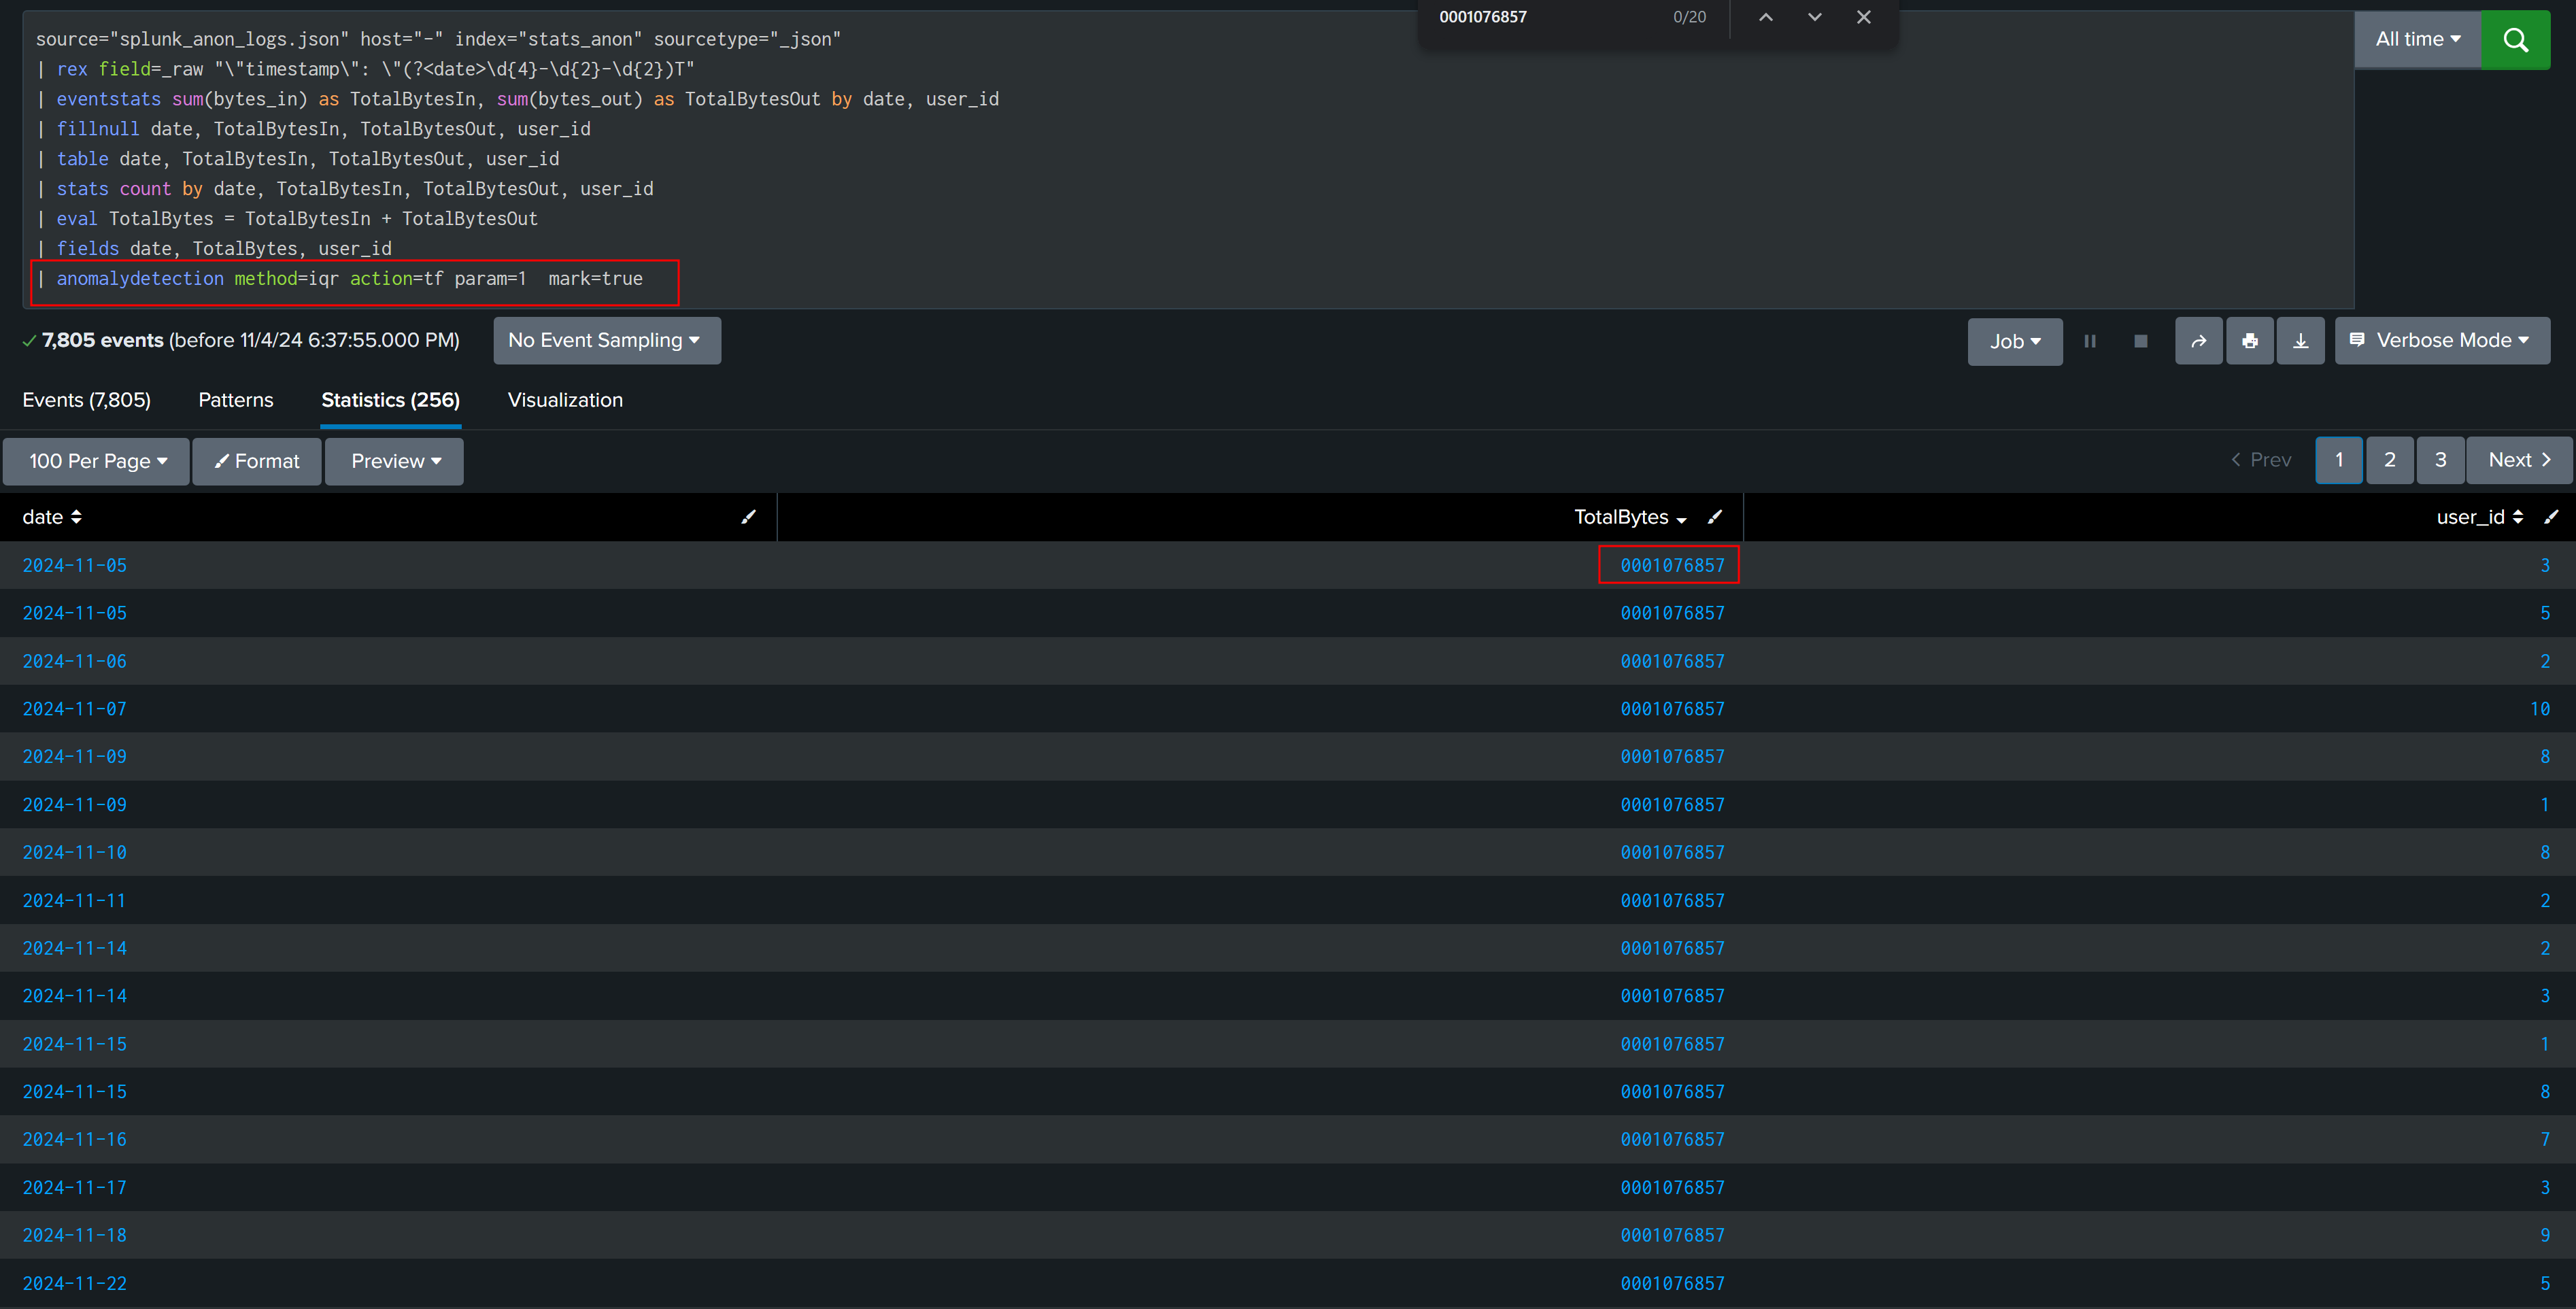
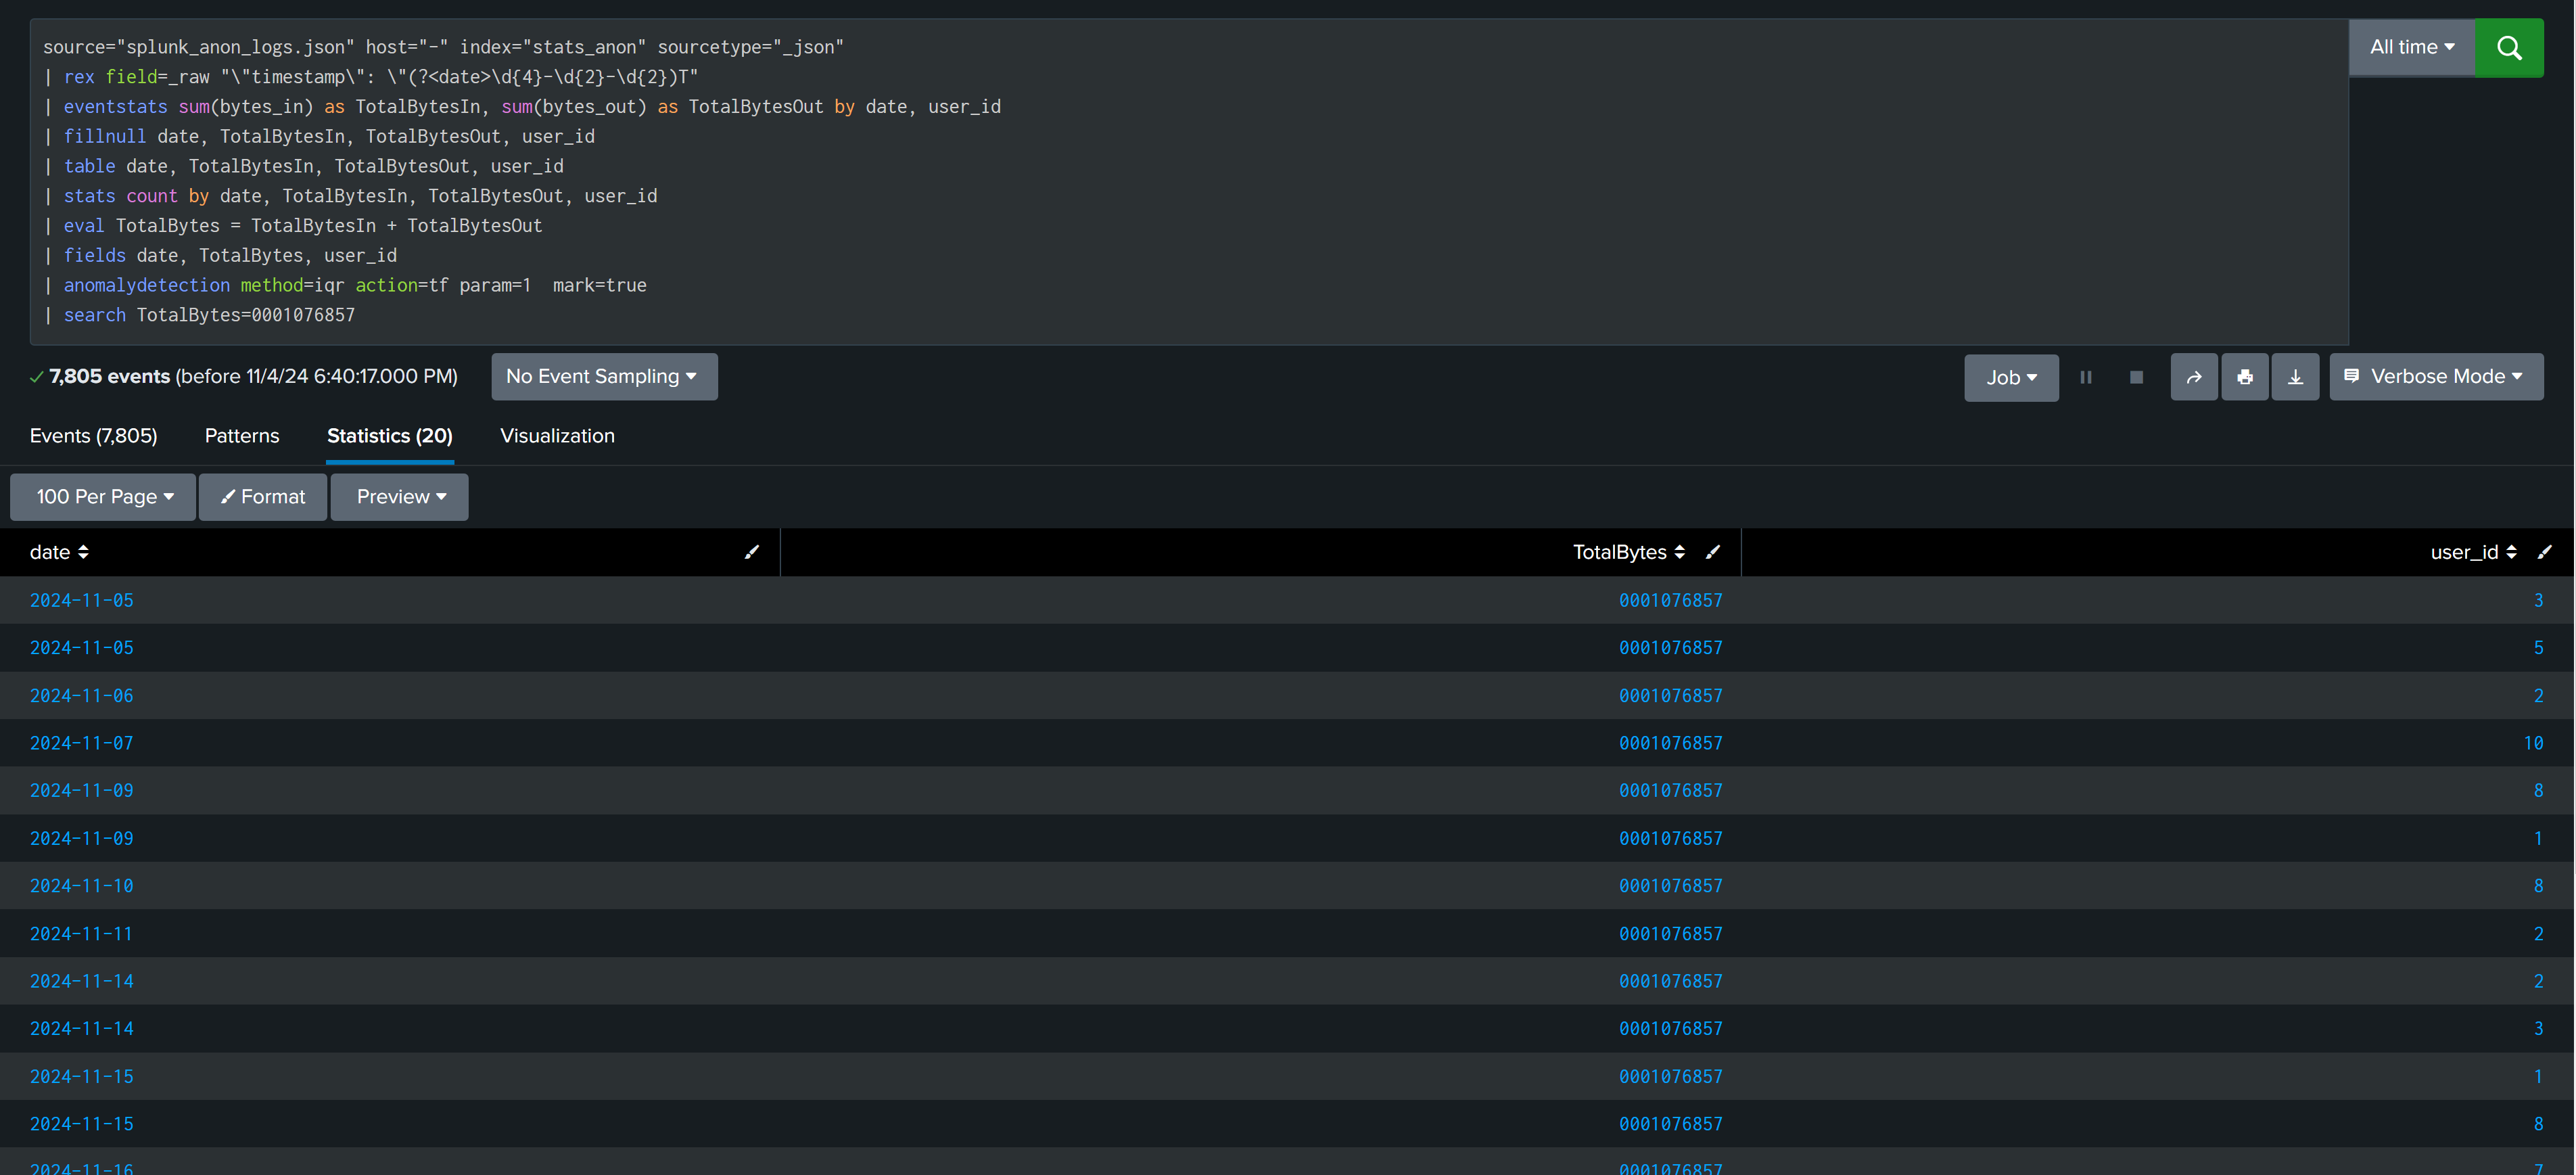
There are commands in splunk like anomalydetection that can perform all calculations in background and give you the results.
In case of credit card transactions anomalydetection command found the correct result and no calculation of multiplier is required.
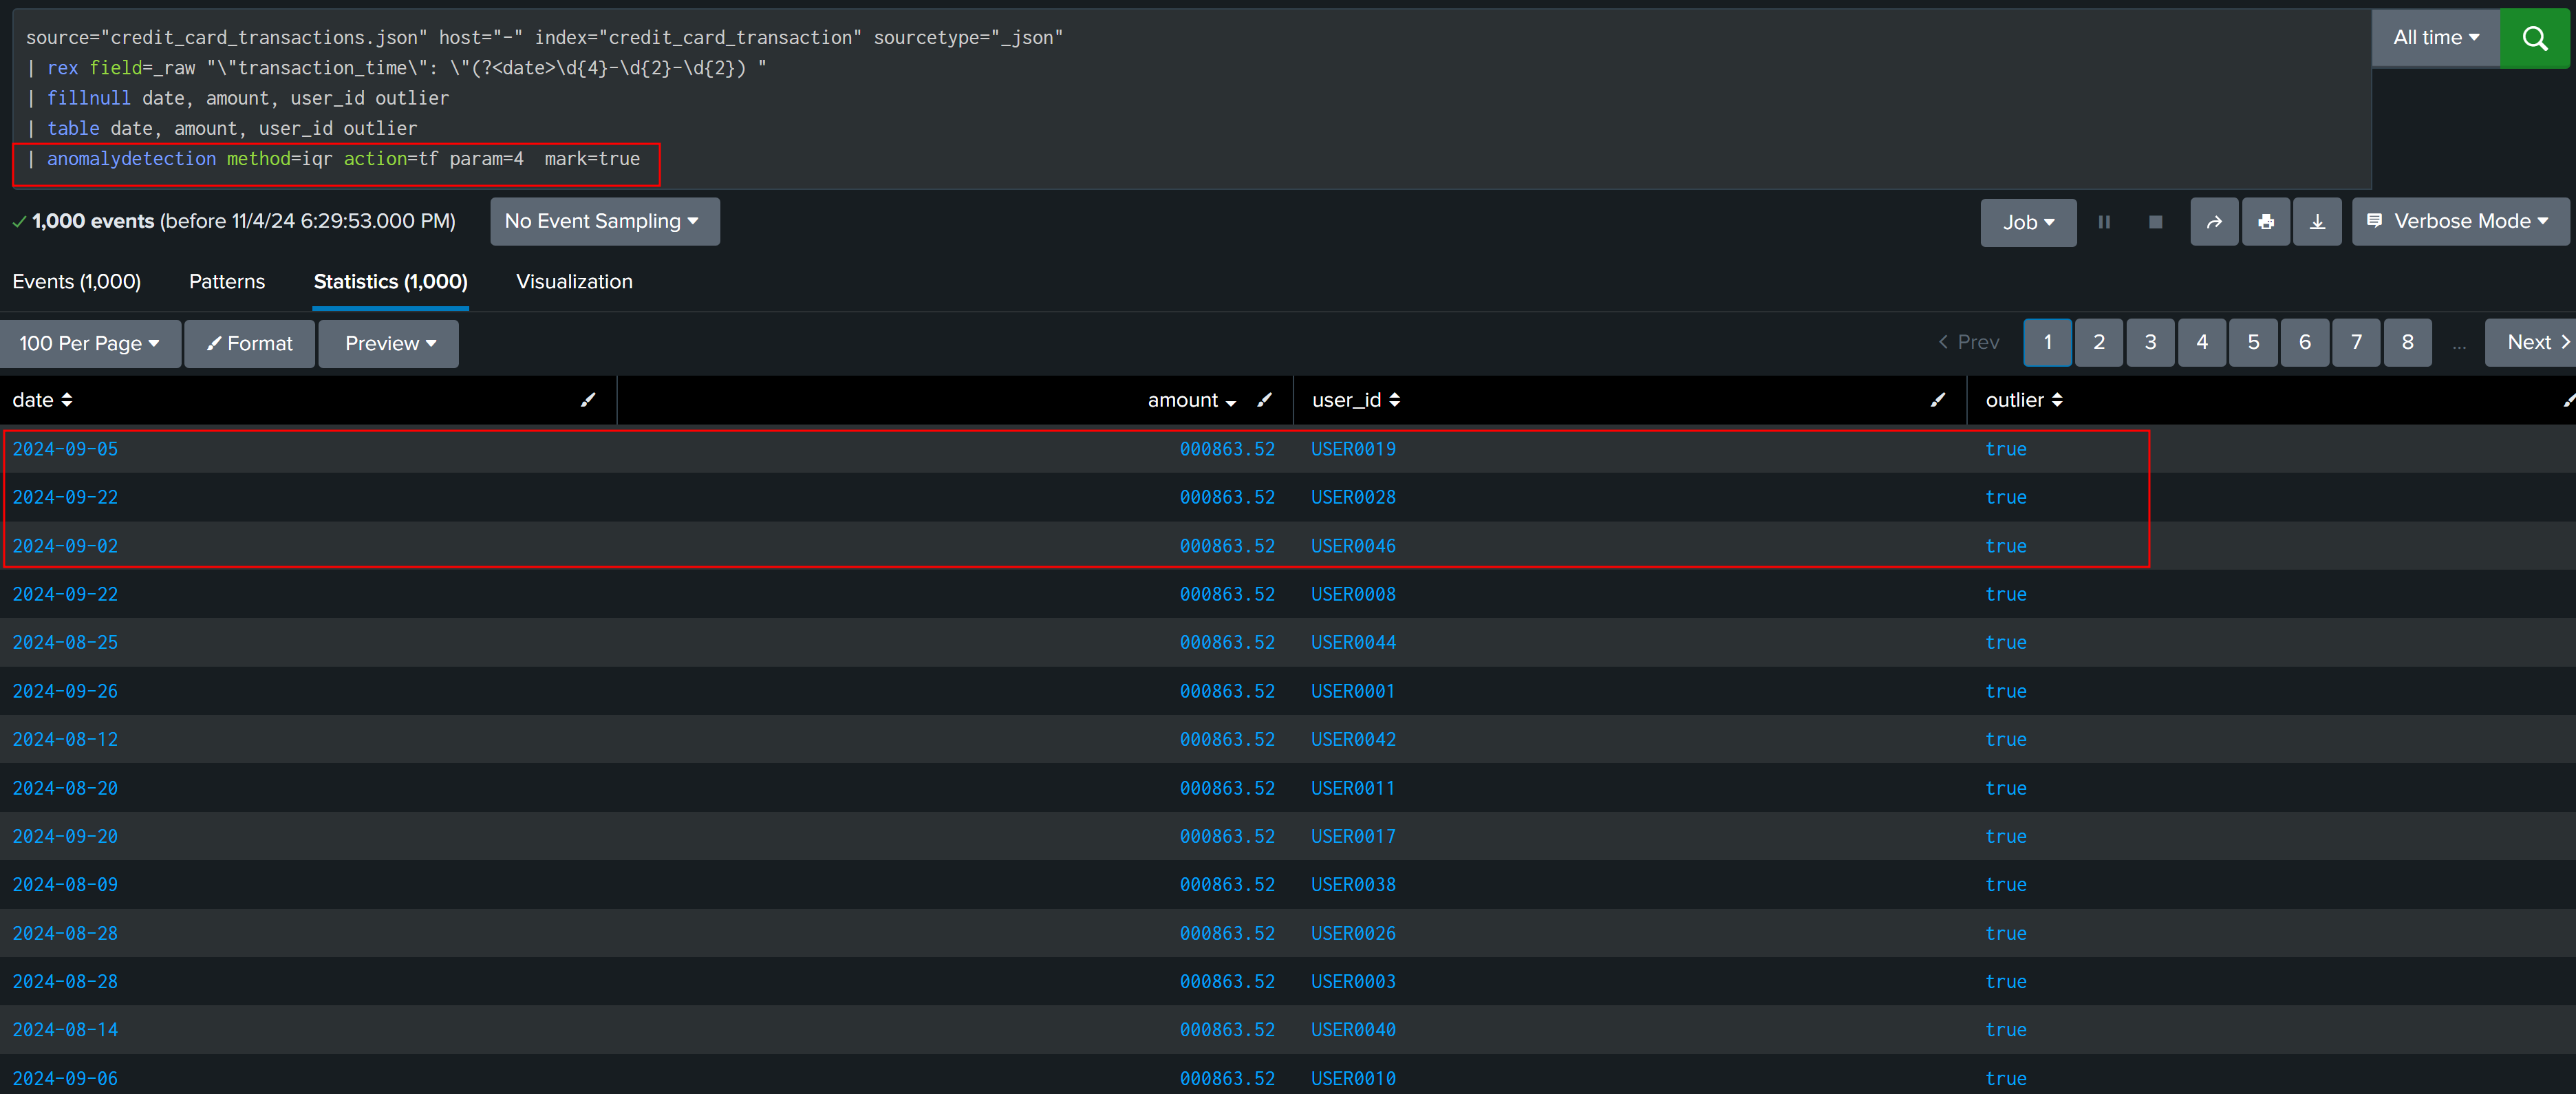
But in case of web traffic activity result from both command and our own calculated IQR outliers are different. This again shows that there is no single formula/solution that will work in all case, we have to check and analyze our data to find best way to find outliers.
User Web Traffic Activity Without anomalydetection commands
User Web Traffic Activity With anomalydetection commands
I hope after reading this post, your understanding of statistical concepts is refreshed, and you have gained insight into how and when statistics can be applied in detection engineering.
References #
Basic To Intermediate Statistics - Krish Naik
Developing the Splunk App for Anomaly Detection