Overview #
The second part of the Memory Forensics Mastery will focus on the concept of how memory should be acquired, what are tools available, what are the different ways to acquire volatile data from system. This blog will also try to discuss points which every analyst, responder or investigator should keep in mind while acquiring memory.
[!NOTE] : If you spot any mistakes or areas for improvement in my blog, feel free to reach out to me via email or on any platform. I welcome constructive feedback and am always eager to enhance the quality of my content.
[!NOTE] : This is not the complete guide or documentation on how to acquire memory and not guarantee any tools or it’s unusual behavior and not recommending any specific tool you should use for your investigation.
What is Memory Acquisition #
Let’s start from basic what exactly mean by Memory Acquisation. Memory Acquisition is a technique in which we collect volatile ( RAM ) data and store to non-volatile storage ( HDD, SSD, USB ). Sometime there are cases in which system’s are already shutdown or investigator don’t know the password of system to login or user log out in those cases we have to depend on alternative solution like DMA ( Direct Memory Access ) when you are not able to login or can’t dump system memory using software tools. Other alternative solution are pagefile.sys, hiberfil.sys which probably not provide the exact details as proper memory acquisition can provide but sometimes helpful to prove a point in case.
Tools #
Today we have lot of software & hardware tools available for memory acquisition. It is always recommended that don’t just choose a tool for your work/investigation because it is reviewed as great product by any blog/website/vendor, there are cases when your favorite tool will not work and you have to switch to another tool or the recommended tool is not capable to dump the memory for your case.
When we choose any tool we should keep some points in mind:
- Are we okay with a tool that is too noisy : GUI Tools loads dlls, open handles to files, update registry keys so keep this is mind maybe your tool is overwriting critical information in memory.
- Is Remote Acquisition required: With technology advancement we have option to acquire any device memory remotely but in this case we should think, is tool overwriting any information in memory like when we choose remote acquisition then it will use packets and those will also use part of our memory and may overwrite other packets or memory region that contains compromise evidence.
- Is collecting device memory range required: We will later discuss what are device memory ranges, but some tools are not capable of dumping device memory ranges or some may alter the system state or crash system if not written properly.
- System architecture : Is your tool supports both x64 and x86 architecture or there is some limitations.
- OS Specific: Check if your tool is capable of collecting any OS memory or it is os specific.
There can be lot more question you can ask yourself and your team before choosing/purchasing a tool for your work. Even if you finally purchase or selected a tool always test it in similar environments, so that you are aware in which scenario your tool will fail or which options you should avoid to not crash the system.
Hardware Tools #
[⚠ !NOTE ⚠ ] : Details are from vendor website and validating vendor claims is out of scope for this blog.
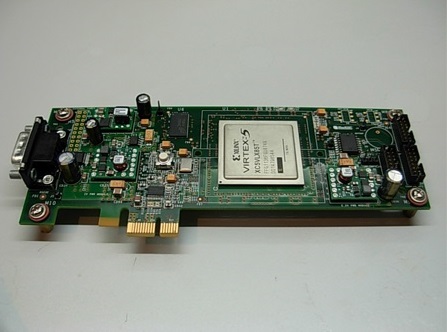
This is a PCI Express add-on device* capable of imaging the physical memory of the computer it’s connected to. It creates dump files in the standard WinDD format that can be used with WindowsSCOPE or with other WinDD compatible dump analysis tools. It connects directly to the physical memory to read its contents. It requires a small CaptureGUARD driver to be installed on the system for the device to be recognized and to store memory contents to file. Unlike software-based memory acquisition tools, CaptureGUARD retrieves raw memory content directly from RAM independent from the operating system which can be compromised by malware.
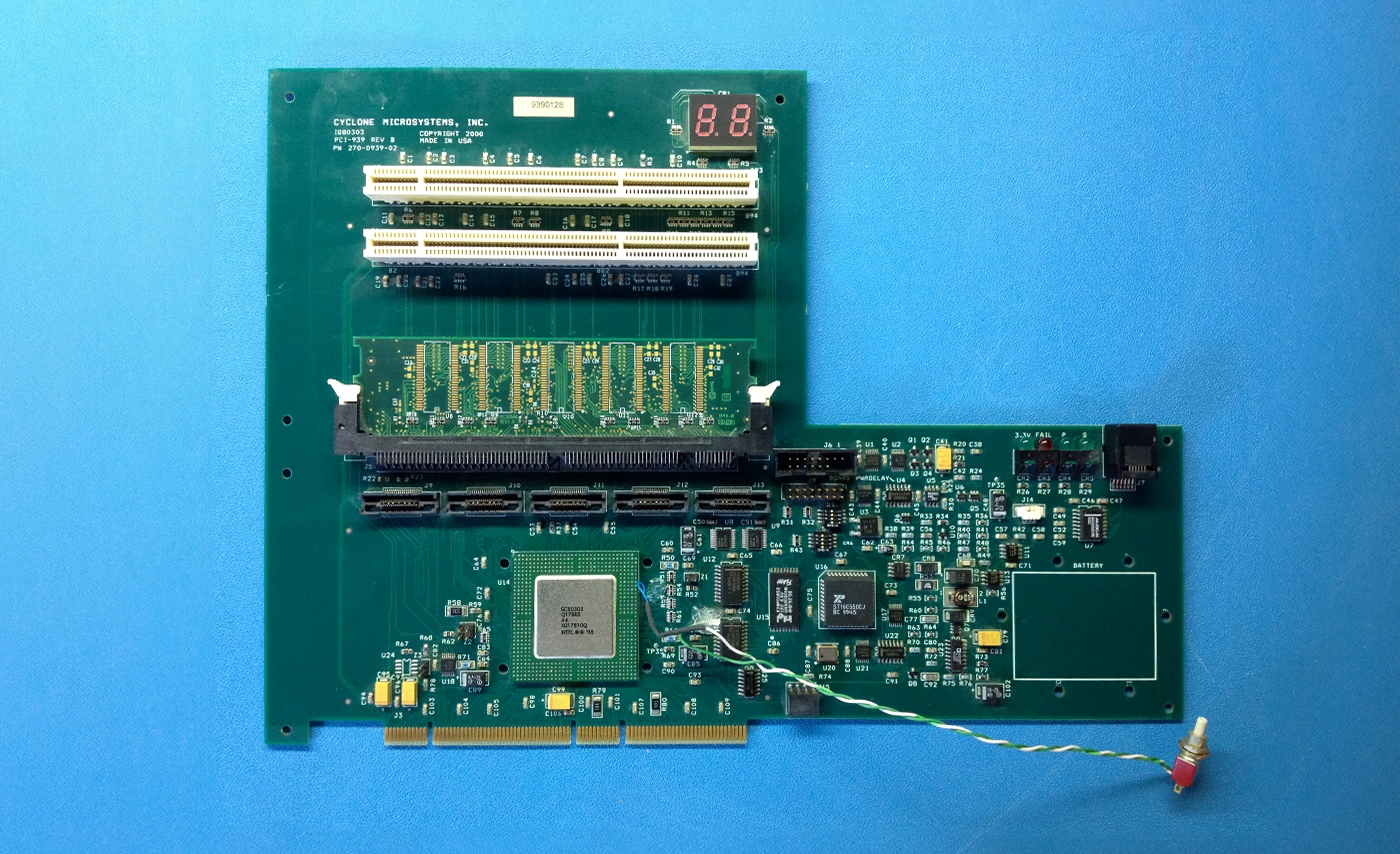
Tribble is a hardware expansion card that reliably acquires the volatile memory of an active computer system and retains critical information necessary for forensic analysis in the event of a computer misconduct. The device accesses the target’s memory directly through a hardware interface and does not require any software or drivers to be loaded.
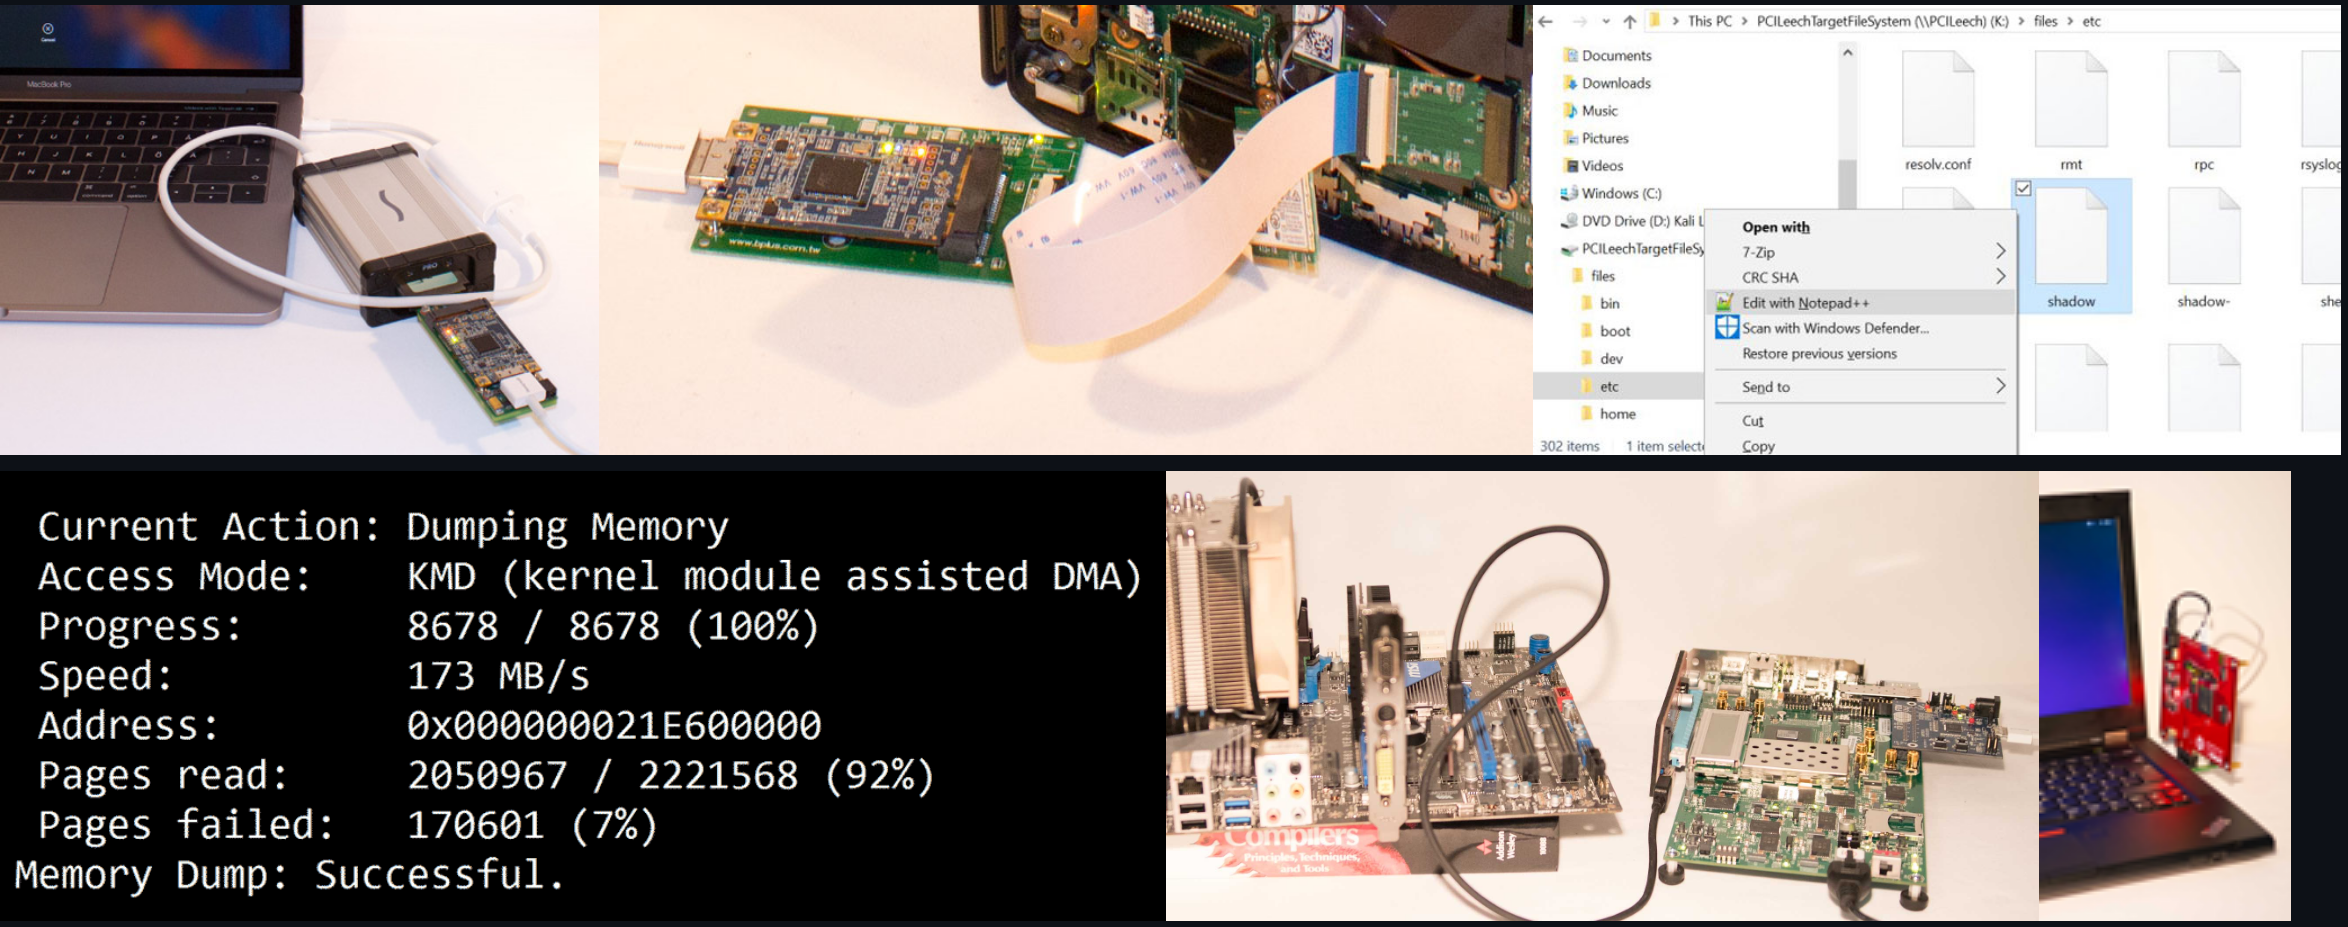
PCILeech uses PCIe hardware devices to read and write target system memory. This is achieved by using DMA over PCIe. No drivers are needed on the target system.
Software Tools #
[⚠ !NOTE ⚠ ] : Details are from vendor website and validating vendor claims is out of scope for this blog.
Windows #
Belkasoft Live RAM Capturer is a tiny free forensic tool that allows to reliably extract the entire contents of computer’s volatile memory—even if protected by an active anti-debugging or anti-dumping system.
FTK® Imager is a data preview and imaging tool that lets you quickly assess electronic evidence
With FTK Imager, you can:
- Create forensic images of local hard drives, floppy diskettes, Zip disks, CDs, and DVDs, entire folders, or individual files from various places within the media.
- Preview files and folders on local hard drives, network drives, floppy diskettes, Zip disks, CDs, and DVDs
- Preview the contents of forensic images stored on the local machine or on a network drive
- Mount an image for a read-only view that leverages Windows Explorer to see the content of the image exactly as the user saw it on the original drive.
- Export files and folders from forensic images.
Important: When using FTK Imager to create a forensic image of a hard drive or other electronic device, be sure you are using a hardware-based write-blocker. This ensures that your operating system does not alter the original source drive when you attach it to your computer.
DumpIt is a fast memory acquisition tool for Windows (x86, x64, ARM64). Generate full memory crash dumps of Windows machines.
Key Features & Benefits
-
Easy to Deploy: No pre-installed agent is required. Machine states can be collected via DumpIt and its PowerShell interface to provide your organization with more flexibility.
-
Super Fast: Every minute counts when investigating a security incident. Since its initial release 10 years ago, DumpIt has been known for its super fast speed of memory acquisition.
-
No BSOD: Generate full memory Microsoft crash dumps on the fly without having to trigger a “Blue Screen of Death (BSOD)”
WinPmem is a physical memory acquisition tool with the following features:
-
Open source
-
Support for Win7 - Win 10, x86 + x64. The WDK7600 might be used to include WinXP support. As default, the provided WinPmem executables will be compiled with WDK10, supporting Win7 - Win10, and featuring more modern code.
-
Three independent reading methods, with two methods to create a complete memory dump. One method should always work even when faced with kernel mode rootkits.
Raw memory dump image support.
- A read device interface is used instead of writing the image from the kernel like some other imagers. This allows us to have complex userspace imager (e.g. copy across network, hash etc), as well as run analysis on the live system (e.g. can be run directly on the device).
Magnet Response is a free and easy-to-use solution to quickly collect and preserve data from local endpoints before it is potentially modified or lost. A pre-set collection profile gives you the ability to target a comprehensive set of files and data relevant to incident response investigations, including RAM.
Key Benefits & Features:
- Easy-To-Use: A guided two-step process and progress bar is straightforward for even non-technical users to use
- Fast & Comprehensive: Collect and preserve data starting with the most volatile using the built-in Comae RAM capture (MAGNET DumpIt) functionality, and volatile data and files commonly associated to cybercrime, such as Windows Event Logs, Registry Hives, Jumplist files, and many other log files in minutes – no need for multiple tools to get the IR data you need
- Portable: It is comprised of a single executable file, is easily downloaded, and can be stored and run from a USB key
- Collect by Keyword & Skip Large Files: configure free-form collections using your own set of keywords (or the defaults provided), with the option to limit the size of files collected to maintain speed
- Consolidated Output: Output is consolidated and saved as a .zip file for easy delivery or processing and analysis in Magnet AXIOM & Magnet AXIOM Cyber Data Integrity: An embedded hash value is provided to verify the integrity of the data
Magnet RAM Capture is a free imaging tool designed to capture the physical memory of a suspect’s computer, allowing investigators to recover and analyze valuable artifacts that are often only found in memory.
Linux #
Details from Kali.org Program which dumps system memory to the standard output stream, skipping over holes in memory maps. By default, the program dumps the contents of physical memory.
This program will not work if CONFIG_STRICT_DEVMEM is enabled in kernel. Since 2.6 version, several kernels are enabling this option by default.
memdump is useful in security tests and forensics investigations.
dumpit-linux (or DumpItForLinux) is very straight forward - the only thing you need is root permission as it relies on /proc/kcore to create a compact version, and is compatible with the old and new versions of /proc/kcore.
Following the same philosophy as DumpIt for Windows which relies on the Microsoft Crash Dump format and is fully compatible with WinDbg, DumpItForLinux relies on the Linux ELF Core format and is fully compatible with gdb, crash, and drgn.
In short, why you should use this utility:
- Interoperability. The generated output file is compatible with popular Linux debugging and troubleshooting tools and frameworks: gdb, crash, and drgn.
- Open file formats. The output file does not rely on a new file format, it creates a Linux ELF CORE file which is the reason it is interoperable with the above tools. And, the utility leverages an existing compression archive format (.tar.zst) which relies on the super-fast zstandard compression algorithm.
- Rust. This utility has been written in Rust, meaning that it is not only memory-safe - it can later be expanded to support additional remote streaming options.
- User-land. This utility relies on /proc/kcore meaning that no Linux kernel module is required. Root permission is, however, needed.
Linpmem offers an API for reading from any physical address, including reserved memory and memory holes, but it can also be used for normal memory dumping. Furthermore, the driver offers a variety of access modes to read physical memory, such as byte, word, dword, qword, and buffer access mode, where buffer access mode is appropriate in most standard cases. If reading requires an aligned byte/word/dword/qword read, Linpmem will do precisely that.
Currently, the Linpmem features:
- Read from physical address (access mode byte, word, dword, qword, or buffer)
- CR3 info service (specify target process by pid)
- Virtual to physical address translation service
A Loadable Kernel Module (LKM) which allows for volatile memory acquisition from Linux and Linux-based devices, such as Android. This makes LiME unique as it is the first tool that allows for full memory captures on Android devices. It also minimizes its interaction between user and kernel space processes during acquisition, which allows it to produce memory captures that are more forensically sound than those of other tools designed for Linux memory acquisition.
AVML - Acquire Volatile Memory for Linux
AVML is an X86_64 userland volatile memory acquisition tool written in Rust, intended to be deployed as a static binary. AVML can be used to acquire memory without knowing the target OS distribution or kernel a priori. No on-target compilation or fingerprinting is needed.
This is not a comprehensive list for all tools available for memory acquisition there are lot of commercial tools which are not covered in this blog.
Methods of Acquiring Memory #
Time to learn how the above tools can be used to dump memory and what exactly they will dump and what information will those dump will contain.
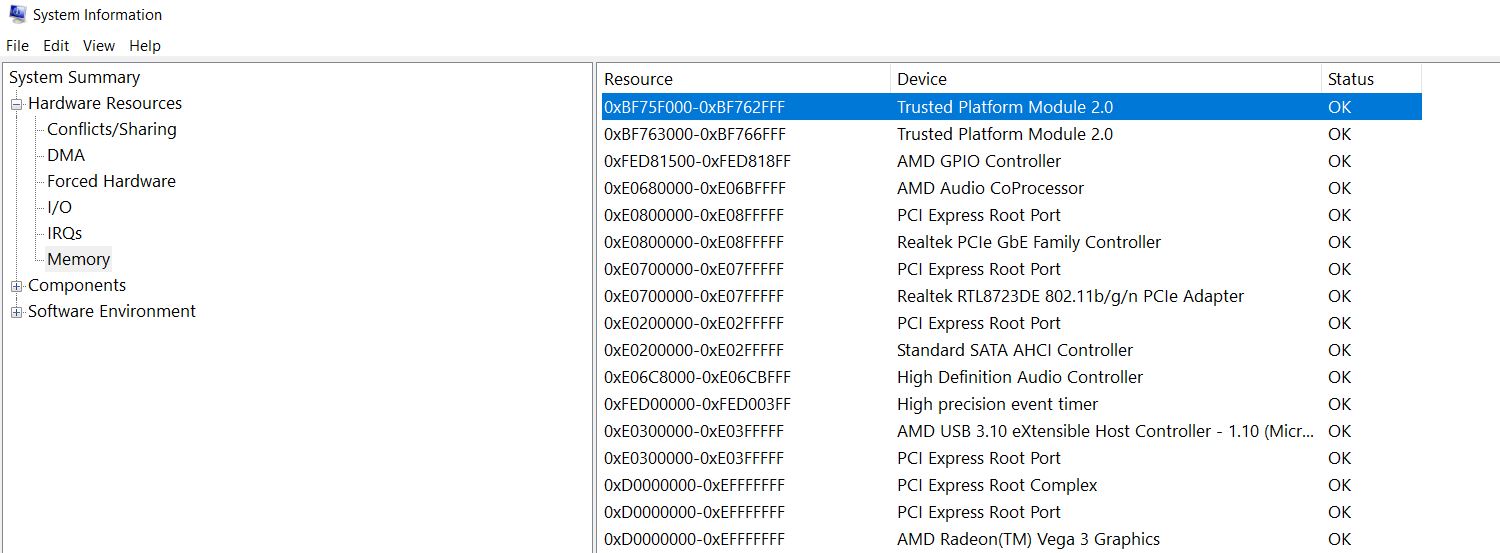
Before going to dumping memory let’s understand a concept of Device Memory Range, this a protected memory range that is used by hardware devices, kernel operations, or secured processes, like sound, network, graphic cards and not acquired by all memory acquisition tool as it can sometime crashes the system if not handled properly and all the volatile evidence is lost.
Acquisition tool uses different approach/WINAPI/method to acquire memory so it is possible one tool is not able to acquire a portion of memory because the WINAPI used by tool alerted the malware and malware paged out itself or obfuscated it, but another tool successfully collect the malware evidence because of different winapi used.
We can check this in winpmem code multiple methods are used to read the memory.
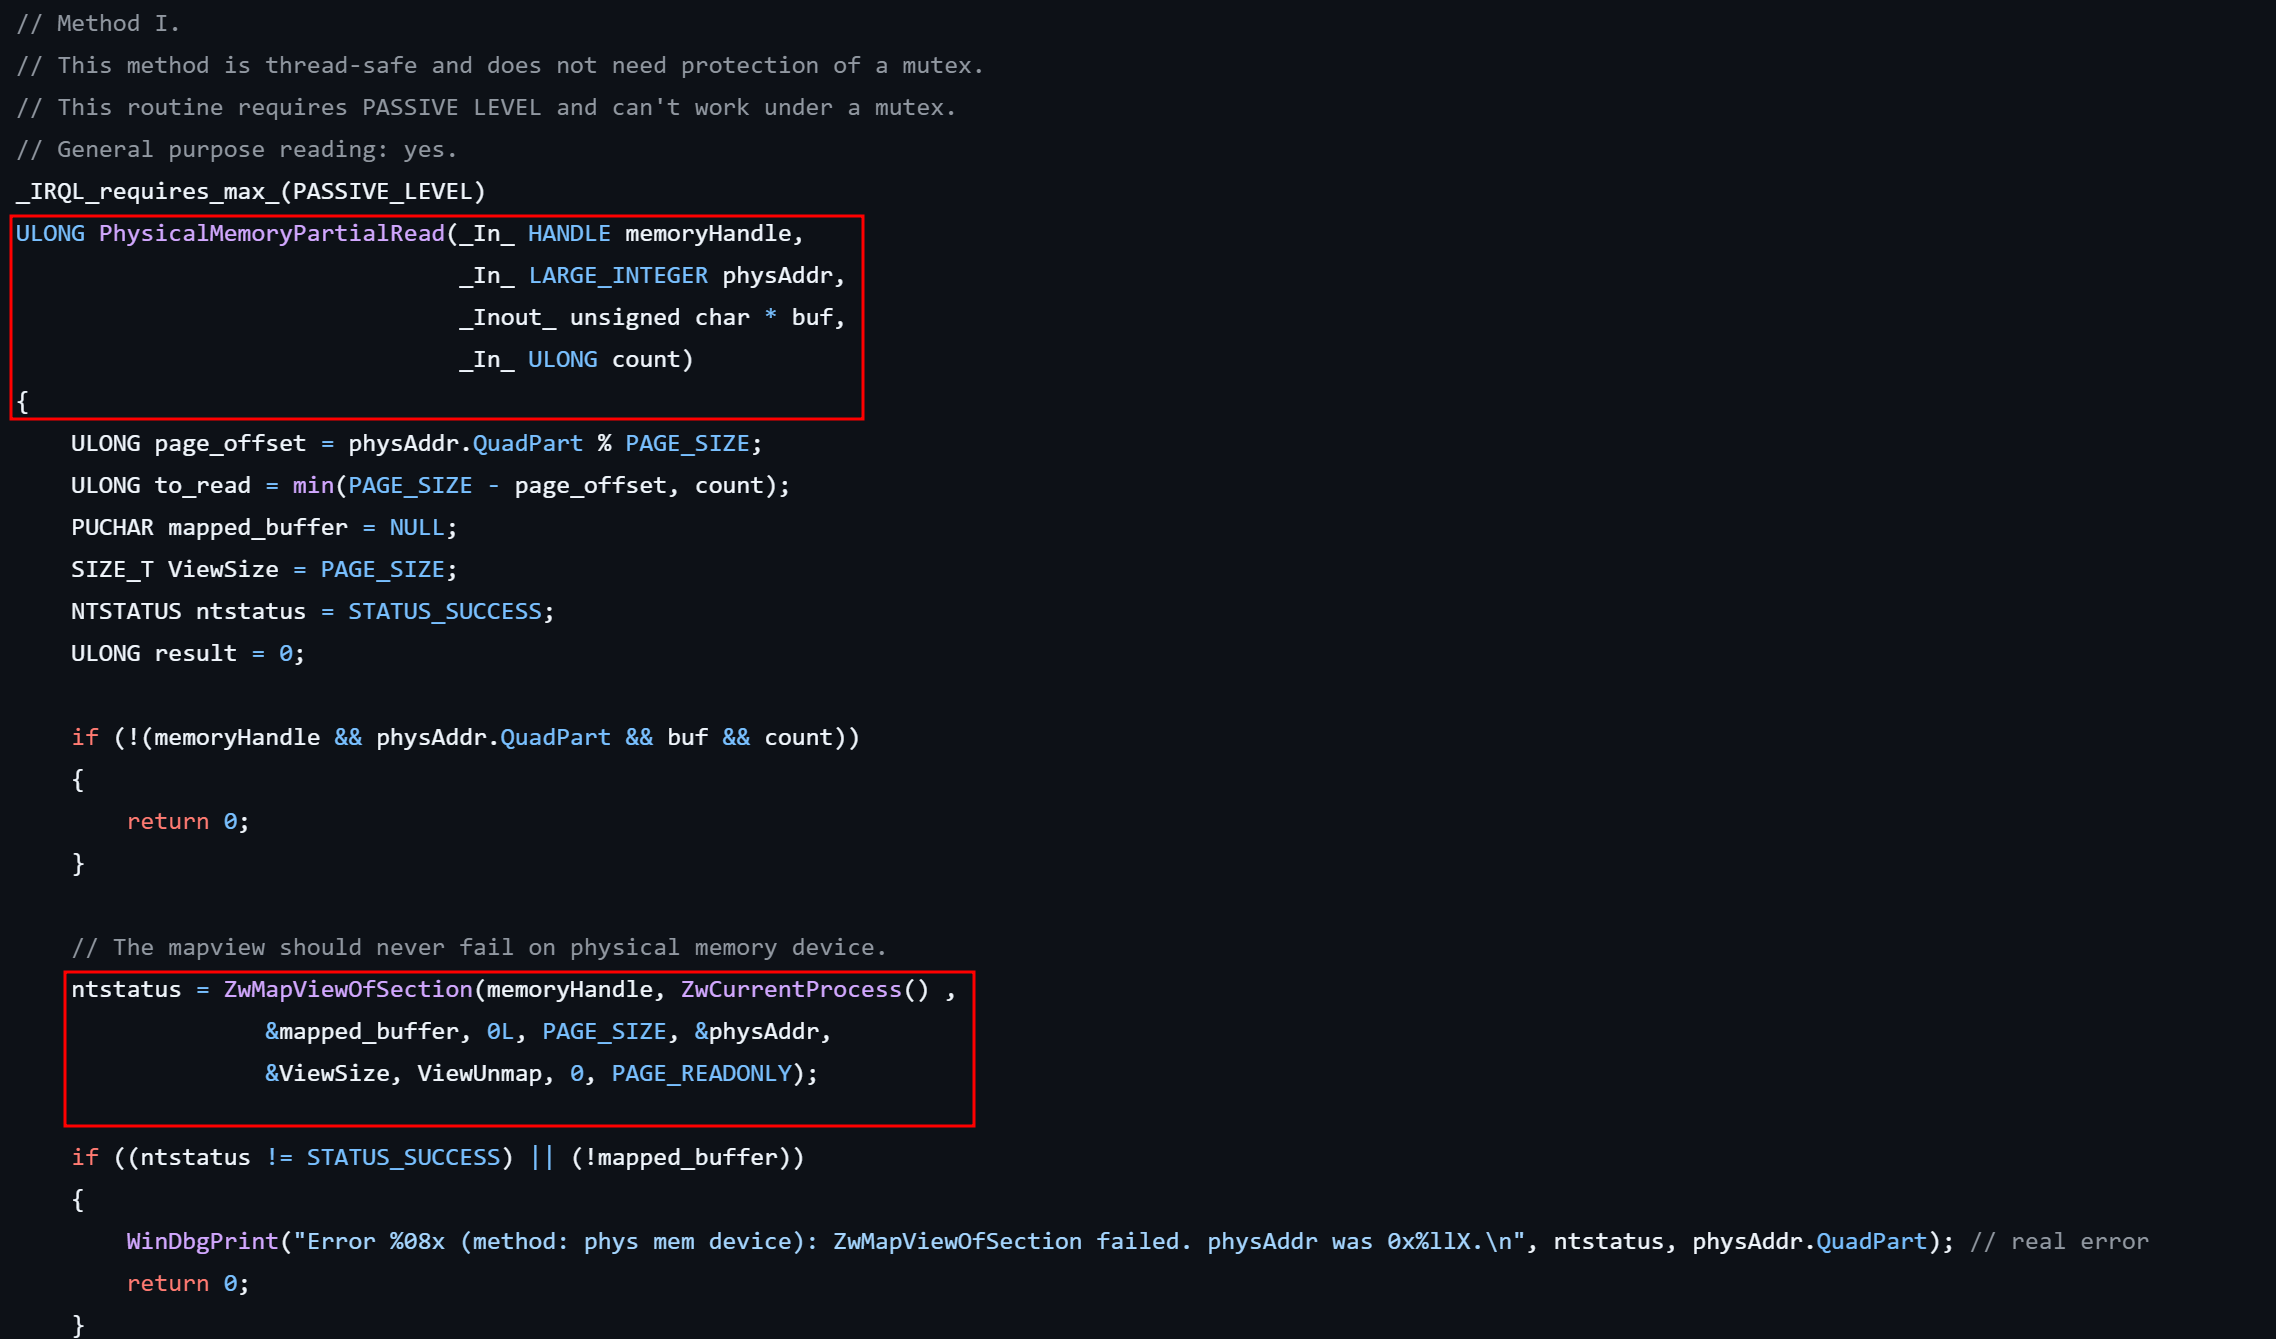
When we acquire a memory we should keep in mind that there are possibility of missing some information and reason can be malware is aware of acquisition and paged out of memory, task is completed before acquisition of that memory region, OS page out or overwrite & Tool is not able to capture the memory properly and corrupted the acquired image and even not shows this failed behavior in it’s logs.
Live Analysis #
There are cases in which we have hundreds of system in environments we are investigating and it is not feasible to dump all device full memory and then investigate them, in such cases we can go with live analysis. There are tools available opensource and commercial that provide functionalities to fetch the details from the live system like process running, network connections, registry information, dumping process memory etc and we can execute queries on multiple system and collect information and start investigation as soon as possible and later we can dump full memory of system we found compromised or suspicious.
Tools :
Full RAM Dump #
This is process in which complete physical memory is dump [ except : device memory range or any protected memory space that your tool is not to able to read ] to a non-volatile storage for further analysis.
It’s is not recommended to dump acquired image on the same system as it can overwrite the unallocated space, the overwrite space can contain deleted files, directories, previous partitions etc.
If you execute your tool from usb stick or external drive using a portable tool that is much better as installing your acquisition tool can update memory region and update the system artifacts like registry keys, $MFT, event logs.
I have attached links to tutorials for how to use different tools to dump RAM as it is already well documented by DFIR Community:
Capturing Memory Dump using WinPmem - cyber nerd
Forensic Memory Acquisition in Windows using FTK Imager - DFIRScience
Windows memory capture using Belkasoft live RAM capture - Md. Mahim Bin Firoj
Memory Dump using DumpIt - iblue.team
Linux Memory Dump using LiME - levelblue.com
Getting Started with Magnet RESPONSE - Magnet Forensics
Capturing Memory Dump using Magnet Ram Capture - cyber nerd
Process Memory Dump #
As we discussed in live analysis sections there are cases in which we don’t require full memory dump, reason can be anything not required for the case, need to focus on any specific process, already found the culprit process/file/driver etc.
In that case we can dump only the process we are interested to investigate.
Tools:
Crashdump #
A system crash (also known as a “bug check” or a “Stop error”) occurs when Windows can’t run correctly. The dump file that is produced from this event is called a system crash dump. A manual kernel or complete memory dump file is useful when you troubleshoot several issues because the process captures a record of system memory at the time of a crash. [ Source: Microsoft]
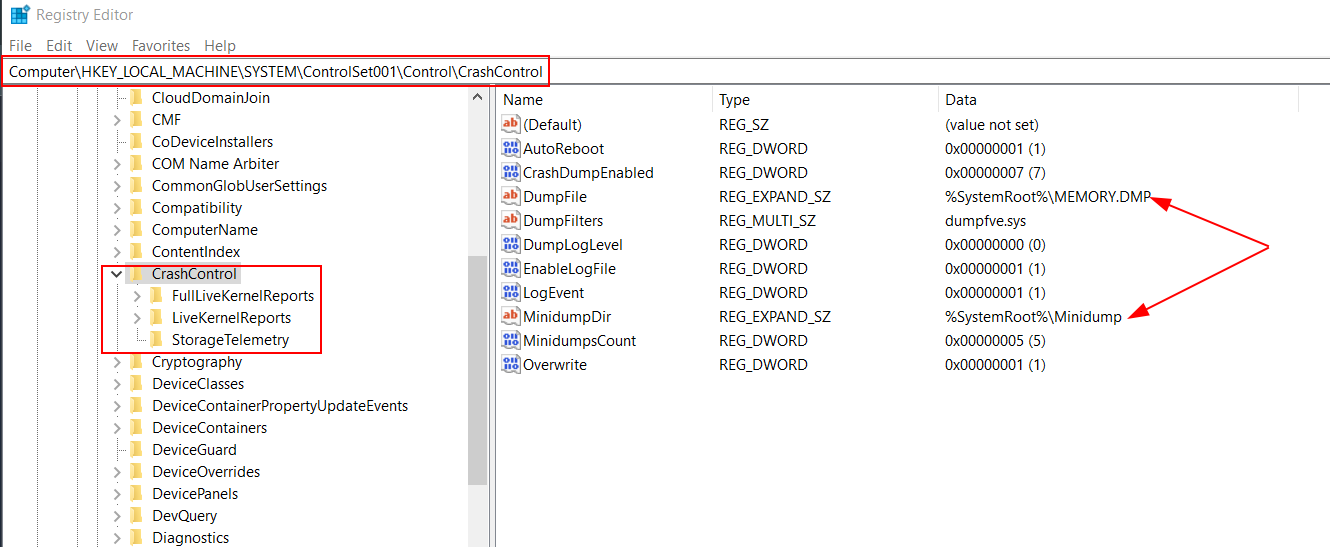
There are multiple type of crash dumps Full, Kernel , Mini dump and they collect different data, it is better we rethink on our decision before crashing system or process. Like Full/Complete Memory Dump will contains same content as physical memory and Mini dump only contains stop code, parameters, list of loaded device drivers, information about the current process and thread, and the kernel stack for the thread that caused the crash.
For more details on crashdumps check Microsoft Blog : Understanding Crash Dump Files
Tools:
Pagefile & Hibernation #
The pagefile.sys file, also known as a page or paging file, is a default system file found on Windows operating systems, including Windows 10, Windows 11, and Windows Server. A page file is a way for Windows to virtually extend the available memory on a system.[Soucre : pdq.com]
The hyberfil.sys file, contains the copy of physical memory in windows OS. It is located in the root directory c:\hiberfil.sys, it get’s created when system goes into hybrid sleep.
Disable and re-enable hibernation - Microsoft Tools:
There is more to learn about hibernation, Windows provide WINAPI like RegisterPowerSettingNotification, SetThreadExecutionState and broadcast messages like WM_POWERBROADCAST which malware can also use for monitoring power events and can behave accordingly, we have details on this techniques in MITRE ATT&CK and also used by Qakbot, Ursnif .
Persistence -> Power Settings - MITRE ATT&CK
Qakbot Upgrades to Stealthier Persistence Method - binarydefense.com
New Ursnif Variant Targets Japan Packed with New Features - cybereason.com
Virtual Machine Memory Dump #
In this technology era as a developer, security researcher, tester, IT Professional there are scenarios in which we want to test our payloads on more then one OS or OS versions, or want to test our application on multiple OS, in such cases installing new OS and it’s variants directly on bare metal every time is not possible due to various reason, time required, cost included etc. Therefore concept of virtualization is used in every industry and we can check the report from Verified Market Research how fast virtualization software market is growing.

Therefore this is good time to start learning how to acquire and investigate memory from virtualization software like vmware, virtualbox, hyper-V and cloud environments.
VMWare Workstation #
Suspend and Resume a Virtual Machine - vmware
| File | Contains | Created When | Forensic Value |
|---|---|---|---|
| VMEM | Virtual memory (RAM) of the VM. | VM is powered on or running. | High: Captures real-time VM memory. |
| VMSS | Full memory and CPU state when suspended. | VM is suspended. | High: Suspended state can be analyzed. |
| VMSN | VM snapshot state (optionally includes memory). | VM snapshot is created. | Varies: High if memory included, metadata otherwise. |
VirtualBox #
In virtualbox it is not easy as VMWARE that we can find dump in the virtual machine directory, Vbox require additional steps to dump the memory for a VM in paused state or for snapshot using VBoxMange.exe binary in windows.
virtualbox vm memory dump - d33pdiv3r.com
Microsoft Hyper V #
Hyper-V is Microsoft’s hardware virtualization product. It lets you create and run a software version of a computer, called a virtual machine. Each virtual machine acts like a complete computer, running an operating system and programs. When you need computing resources, virtual machines give you more flexibility, help save time and money, and are a more efficient way to use hardware than just running one operating system on physical hardware. Hyper-V runs each virtual machine in its own isolated space, which means you can run more than one virtual machine on the same hardware at the same time. You might want to do this to avoid problems such as a crash affecting the other workloads, or to give different people, groups or services access to different systems. [ Source: Microsoft Blog]
Force Memory Dump on Hyper-V - Dell
Hyper-V VM memory dump using livekd - citrix
Types of Images #
We now have information about different tools, how to use them to acquire memory and dump it to non-volatile storage. If you used multiple tool or tried steps to acquire memory using articles/blogs mentioned in this post then you know that different tool have different file format to dump volatile data, example .raw used to dump raw memory dumps, VMEM used by vmware, DMP for Windows crash dump files, gcore creates ELF Core Dumps and there are lot more formats.
This is also a point which as investigator you should know if your analysis tool is capable of analyzing the format your acquisition tool created, there are cases in which you don’t have any option and have to use a tool which format is not supported by analysis tool in such cases there are few paths:
- Convert one file format to another.
- Use analysis & acquisition tool from same vendor.
- Check if acquisition tool vendor provide any tool to convert from one format to another.
Converting a snapshot file to memory dump using the vmss2core tool - broadcom.com
Crash Dumps, Hibernation, and Conversion - Volatility
Useful debugger commands: .writemem and .readmem - nynaeve.net
Comparison of Tools #
As we discussed earlier each tool are written in different programming language and use different ways to collect memory, use different compression methods, due to which artifacts generated, memory consumption, time to acquire physical memory by each tool will vary.
There is a great blog available which you can check for reference it was written for older version of tools but you will get idea of what artifacts tools can generate when executed under same condition:
Comparison of Memory Acquisition Software for Windows - thanursan
Points To Keep In Mind #
Let’s summarize important points we discussed during the post:
- Never depend on one tool for all cases.
- Always verify you favourite tool/vendor claims before using it in real investigation.
- There are cases in which organization acquired a memory and share with you for analysis, in such cases if possible try to communicate with organization and tell them for desired file format/Tool to make your life easy.
- Always create hash for acquired image to maintain integrity of evidence and make copy of evidence so even if evidence is corrupted because of tool then you atleast have a copy of it.
- Use tool which generate less artifacts or don’t alter artifacts on your victim/suspect device.
- Use external USB/drive to run your tool and store acquired memory.
- Always have a second plan in cases when tool crashes the system or malware shutdown the system etc.
- In every case acquiring full memory dump is not the best due to time restrictions or cost factor as these are different for each case, in that situation you should have clear idea what next you have to do live analysis, process dump etc.
- Always update your tool, malware can exploit known vulnerabilities in acquisition tool.
References #
CrashDumps Details - magnetforensics
Debugging process dump with windbg
Linux core dump analysis on user-space applications
